
USGS researcher at the Oklahoma Cooperative Fish and Wildlife Research Unit tags two pronghorn fawns in Oklahoma.
Images
Images intro.
Filter Total Items: 57
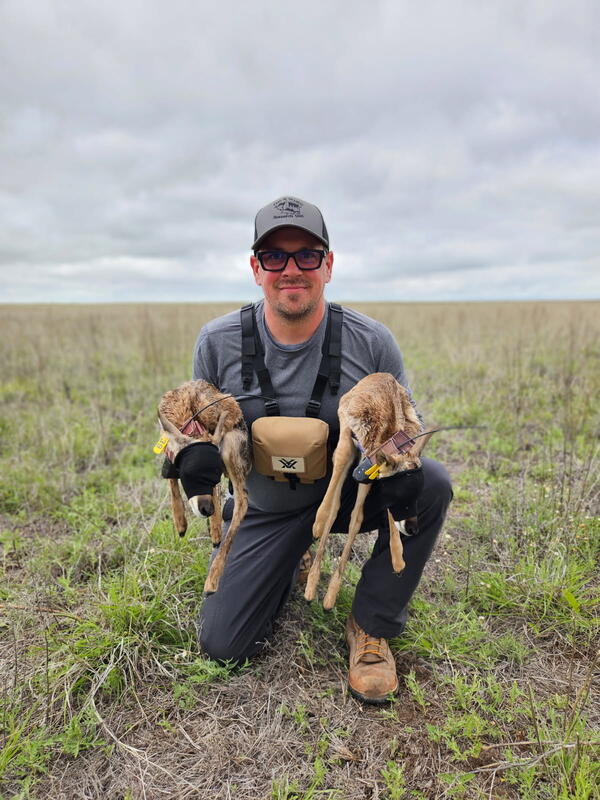
Researcher is tagging pronghorn fawn in Oklahoma
USGS researcher at the Oklahoma Cooperative Fish and Wildlife Research Unit tags two pronghorn fawns in Oklahoma.

Principal aquifers and wells assessed in nationwide NAWQA/GAMA groundwater quality study
Principal aquifers and wells assessed in nationwide NAWQA/GAMA groundwater quality studyMap showing principal aquifers (PAs) and wells that were sampled as part of a Nationwide assessment of the quality of groundwater used for public supply.

Guymon, OK underfly one
Thick vegetation at a Guymon, Oklahoma, site required parking a quarter-mile away. The pickup is visible at the top center of the photo, which was taken on November 11, 2021, the first characterization day there. (Photo by Jeff Irwin, USGS)
Thick vegetation at a Guymon, Oklahoma, site required parking a quarter-mile away. The pickup is visible at the top center of the photo, which was taken on November 11, 2021, the first characterization day there. (Photo by Jeff Irwin, USGS)

Downstream view of North Canadian River at Britton Rd at Oklahoma City
Downstream view of North Canadian River at Britton Rd at Oklahoma CityView downstream from the bridge at USGS site 07241520, North Canadian River at Britton Rd at Oklahoma City, OK
Downstream view of North Canadian River at Britton Rd at Oklahoma City
Downstream view of North Canadian River at Britton Rd at Oklahoma CityView downstream from the bridge at USGS site 07241520, North Canadian River at Britton Rd at Oklahoma City, OK

Rafts, kayaks, and canoes on the Illinois River near Moodys, Oklahoma, (station 07196320) on a busy summer Saturday during the peak of the recreational floating season
Rafts, kayaks, and canoes on the Illinois River near Moodys, Oklahoma, (station 07196320) on a busy summer Saturday during the peak of the recreational floating seasonRafts, kayaks, and canoes pass downstream of the Illinois River Floatcam on the Illinois River near Moodys, Oklahoma, (station 07196320) on a busy summer Saturday during the peak of the recreational floating season. The Illinois River Floatcam is located at USGS station 0719
Rafts, kayaks, and canoes on the Illinois River near Moodys, Oklahoma, (station 07196320) on a busy summer Saturday during the peak of the recreational floating season
Rafts, kayaks, and canoes on the Illinois River near Moodys, Oklahoma, (station 07196320) on a busy summer Saturday during the peak of the recreational floating seasonRafts, kayaks, and canoes on the Illinois River near Moodys, Oklahoma, (station 07196320) on a busy summer Saturday during the peak of the recreational floating season
Rafts, kayaks, and canoes on the Illinois River near Moodys, Oklahoma, (station 07196320) on a busy summer Saturday during the peak of the recreational floating seasonRafts, kayaks, and canoes pass downstream of the Illinois River Floatcam on the Illinois River near Moodys, Oklahoma, (station 07196320) on a busy summer Saturday during the peak of the recreational floating season. The Illinois River Floatcam is located at USGS station 0719

Oklahoma Landsat State Mosaic
Oklahoma has the largest Native American population of any state. Many of the 250,000 American Indians living in Oklahoma are descended from the original 67 tribes who inhabited Indian Territory. Oklahoma is tribal headquarters for 39 tribes.
Capital Oklahoma City
Image Source Landsat 8
Oklahoma has the largest Native American population of any state. Many of the 250,000 American Indians living in Oklahoma are descended from the original 67 tribes who inhabited Indian Territory. Oklahoma is tribal headquarters for 39 tribes.
Capital Oklahoma City
Image Source Landsat 8

USGS employees on SH 104 near the Arkansas River near Haskell, OK
USGS employees on SH 104 near the Arkansas River near Haskell, OKPhotograph showing USGS employees on State Highway 104 near the Arkansas River near Haskell, Oklahoma, streamgage (07165570). Photograph by Kevin Smith, U.S. Geological Survey.
U.S. Geological Survey Open-File Report 2020–1090

Sampling rain induced runoff from wastewater effluent-irrigated agricultural runoff site on August 30, 2019, at the Oklahoma State University South Central Research Station in Chickasha, Oklahoma. Photograph by Jason Masoner, U.S. Geological Survey.
Sampling rain induced runoff from wastewater effluent-irrigated agricultural runoff site on August 30, 2019, at the Oklahoma State University South Central Research Station in Chickasha, Oklahoma. Photograph by Jason Masoner, U.S. Geological Survey.This photo show runoff from an experimental plot through a weir. Scientists carried out the study at the Oklahoma State University South Central Research Station in Chickasha, Oklahoma. Its a good example of rain induced runoff.
Sampling rain induced runoff from wastewater effluent-irrigated agricultural runoff site on August 30, 2019, at the Oklahoma State University South Central Research Station in Chickasha, Oklahoma. Photograph by Jason Masoner, U.S. Geological Survey.
Sampling rain induced runoff from wastewater effluent-irrigated agricultural runoff site on August 30, 2019, at the Oklahoma State University South Central Research Station in Chickasha, Oklahoma. Photograph by Jason Masoner, U.S. Geological Survey.Sampling rain induced runoff from wastewater effluent-irrigated agricultural runoff site on August 30, 2019, at the Oklahoma State University South Central Research Station in Chickasha, Oklahoma. Photograph by Jason Masoner, U.S. Geological Survey.
Sampling rain induced runoff from wastewater effluent-irrigated agricultural runoff site on August 30, 2019, at the Oklahoma State University South Central Research Station in Chickasha, Oklahoma. Photograph by Jason Masoner, U.S. Geological Survey.This photo show runoff from an experimental plot through a weir. Scientists carried out the study at the Oklahoma State University South Central Research Station in Chickasha, Oklahoma. Its a good example of rain induced runoff.
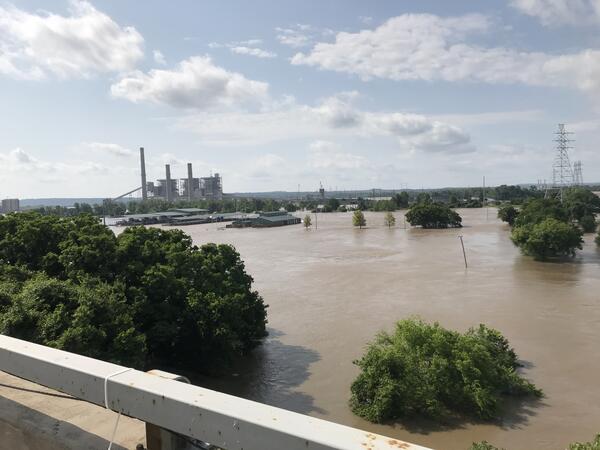
US Highway 62 bridge, Arkansas River near Muskogee, OK flooding
US Highway 62 bridge, Arkansas River near Muskogee, OK floodingLooking downstream from U.S. Highway 62 bridge at the widespread flooding and backwater conditions on the Arkansas River near Muskogee, Oklahoma, May 31, 2019.
U.S. Geological Survey Open-File Report 2020–1090
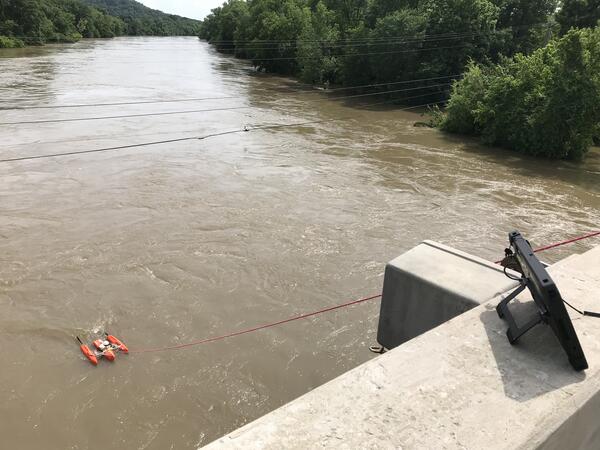
streamflow measurement from State Highway 20 bridge
streamflow measurement from State Highway 20 bridgeA direct streamflow measurement from the State Highway 20 bridge, looking downstream on the Verdigris River near Claremore, Oklahoma, near U.S. Geological Survey streamgage 07176000.
U.S. Geological Survey Open-File Report 2020–1090

National Oil and Gas Assessment Provinces
This is a graphic from the USGS National Oil and Gas Assessment Explorer application, which allows user to drill into 70 oil and gas assessment provinces throughout the United States.
This is a graphic from the USGS National Oil and Gas Assessment Explorer application, which allows user to drill into 70 oil and gas assessment provinces throughout the United States.

North Canadian River at Shawnee, OK
View from bridge of USGS gage 07241800, North Canadian River at Shawnee, OK
View from bridge of USGS gage 07241800, North Canadian River at Shawnee, OK

Illinois River Floatcam
Rafters enjoy the floating down the Illinois River in northeast Okalahoma.
Rafters enjoy the floating down the Illinois River in northeast Okalahoma.

Tonkawa Geoprobing 052517
Tonkawa Geoprobing 052517

Geoprobe fieldwork at Tonkawa, OK
Geoprobe fieldwork at Tonkawa, OK

Chikaskia River at Tonkawa, OK
Chikaskia River at Tonkawa, OK

Groundwater-monitoring well in Osage County, Oklahoma.
Groundwater-monitoring well in Osage County, Oklahoma.Groundwater-monitoring well and telemetry equipment in Osage County, Oklahoma
Groundwater-monitoring well in Osage County, Oklahoma.
Groundwater-monitoring well in Osage County, Oklahoma.Groundwater-monitoring well and telemetry equipment in Osage County, Oklahoma

Pine Creek near Moyer, OK
Pine Creek near Moyer, OK

Fires Burn Farms and Ranches in Oklahoma and Kansas
Fires Burn Farms and Ranches in Oklahoma and KansasLandsat's shortwave infrared (SWIR) band measures reduced moisture content in soil and vegetation. When combined with its near-infrared (NIR) band, which helps reveal actively growing vegetation, Landsat produces highly accurate images and maps of burned areas.

March Wildfires Scorch Kansas, Oklahoma Farm and Ranch Land
March Wildfires Scorch Kansas, Oklahoma Farm and Ranch LandThis March 2017 Landsat 8 image shows massive burned scars in Kansas and Oklahoma. More than 730,000 acres of farm and ranchland were scorched by wind-driven wildfires that began March 6 and were finally extinguished on March 22.

Tuner Falls, OK
Tuner Falls, OK