
Telemetry system of the Yellowstone Seismic Network operated by the University of Utah Seismograph Stations. Black arrows show analog telemetry and pink arrows show digital telemetry. The green line is the boundary of Yellowstone National Park.
Images
Images of Yellowstone.
Filter Total Items: 532

Telemetry system of the Yellowstone Seismic Network
Telemetry system of the Yellowstone Seismic Network operated by the University of Utah Seismograph Stations. Black arrows show analog telemetry and pink arrows show digital telemetry. The green line is the boundary of Yellowstone National Park.

Seismograms showing Yellowstone M4.8 earthquake on March 30, 2014
Record section showing horizontal component seismograms from stations in the Yellowstone region from the M4.8 earthquake that occurred near Norris Geyser Basin on March 30, 2014. The vertical blue dashed line represents the origin time of the earthquake at 12:34:39.16 UTC. The red line represents the P-wave arrival with a velocity of ~5.7 km/s. The
Record section showing horizontal component seismograms from stations in the Yellowstone region from the M4.8 earthquake that occurred near Norris Geyser Basin on March 30, 2014. The vertical blue dashed line represents the origin time of the earthquake at 12:34:39.16 UTC. The red line represents the P-wave arrival with a velocity of ~5.7 km/s. The

Record from Yellowstone station YHB for M4.8 quake of Mar 30, 2014
3-component seismograms from station YHB for the M4.8 earthquake that occurred near Norris Geyser Basin on March 30, 2014, and showing the P-wave arrival pick (red) and the S-wave arrival pick (green) as determined by UUSS analysts. The vertical blue dashed line represents the origin time of the earthquake at 12:34:39.16 UTC.
3-component seismograms from station YHB for the M4.8 earthquake that occurred near Norris Geyser Basin on March 30, 2014, and showing the P-wave arrival pick (red) and the S-wave arrival pick (green) as determined by UUSS analysts. The vertical blue dashed line represents the origin time of the earthquake at 12:34:39.16 UTC.

Seismic stations used to located the March 30, 2014, M4.8 Norris quake
Station map showing seismograph stations used in the location of the M4.8 earthquake that occurred near Norris Geyser Basin on March 30, 2014. The yellow star shows the earthquake epicenter. Red triangles represent seismograph stations with a P-wave arrival pick. Green triangles represent seismograph stations with both a P-wave and a S-wave arrival
Station map showing seismograph stations used in the location of the M4.8 earthquake that occurred near Norris Geyser Basin on March 30, 2014. The yellow star shows the earthquake epicenter. Red triangles represent seismograph stations with a P-wave arrival pick. Green triangles represent seismograph stations with both a P-wave and a S-wave arrival

Time history of Yellowstone caldera uplift and subsidence patterns ...
Time history of Yellowstone Caldera uplift (black line) and subsidence patterns along with quarterly catalog earthquake counts (blue bars). Note that large swarms in 1985 and 2010 accompany uplift to subsidence of caldera. The vertical deformation on the right axis was measured at the Sour Creek (SC) dome in the eastern part of the Yellowstone Caldera.
Time history of Yellowstone Caldera uplift (black line) and subsidence patterns along with quarterly catalog earthquake counts (blue bars). Note that large swarms in 1985 and 2010 accompany uplift to subsidence of caldera. The vertical deformation on the right axis was measured at the Sour Creek (SC) dome in the eastern part of the Yellowstone Caldera.

Example of Yellowstone earthquake multiplets (families of repeating...
The seismic records or waveforms are from two seismic stations, and show the highly repetitive and similar nature of the seismic events.
The seismic records or waveforms are from two seismic stations, and show the highly repetitive and similar nature of the seismic events.

Variations of repeating earthquake activity through time
Top: Map of repeating earthquake areas corresponding to the deformation episodes, below. Bottom: Left 1996-1998 Yellowstone caldera uplift episode. Middle: 1998-2004 subsidence episode. Right: 2004-2010 uplift episode. Bottom: vertical ground deformation from GPS observations at station, WLWY, on the Sour Creek resurgent dome.
Top: Map of repeating earthquake areas corresponding to the deformation episodes, below. Bottom: Left 1996-1998 Yellowstone caldera uplift episode. Middle: 1998-2004 subsidence episode. Right: 2004-2010 uplift episode. Bottom: vertical ground deformation from GPS observations at station, WLWY, on the Sour Creek resurgent dome.

Photos taken from helicopter over Mammoth Hot Springs
Top: Examples of some of the photos taken from helicopter over Mammoth Hot Springs in September 2013. Photos taken by Hank Heasler. Bottom: Hill-shade image calculated from the 2013 DEM over Mammoth Hot Springs and that was derived from a series of overlapping photos using Structure-from-Motion photogrammetry.
Top: Examples of some of the photos taken from helicopter over Mammoth Hot Springs in September 2013. Photos taken by Hank Heasler. Bottom: Hill-shade image calculated from the 2013 DEM over Mammoth Hot Springs and that was derived from a series of overlapping photos using Structure-from-Motion photogrammetry.

Huckleberry Ridge Tuff deposit, Yellowstone
Huckleberry Ridge Tuff deposit exposed on Mt. Everts, near the northern boundary of Yellowstone National Park. The deposit was created by ash falling from the plume early in the eruption sequence, 2.08 million years ago. Photo by Madison Myers, Montana State University.
Huckleberry Ridge Tuff deposit exposed on Mt. Everts, near the northern boundary of Yellowstone National Park. The deposit was created by ash falling from the plume early in the eruption sequence, 2.08 million years ago. Photo by Madison Myers, Montana State University.

Photo of the Old Faithful Inn lobby
Photo of the Old Faithful Inn lobby, which features a six-story-tall fireplace and chimney made from rocks quarried form a rhyolite lava flow in Yellowstone. NPS photo by Jim Peaco, July 22, 2013.
Photo of the Old Faithful Inn lobby, which features a six-story-tall fireplace and chimney made from rocks quarried form a rhyolite lava flow in Yellowstone. NPS photo by Jim Peaco, July 22, 2013.

Map of YNP showing Brimstone Basin and other areas known to release...
Map of Yellowstone National Park showing Brimstone Basin and other areas known to release carbon dioxide from the ground.
Map of Yellowstone National Park showing Brimstone Basin and other areas known to release carbon dioxide from the ground.

YVO Webcam, Oct. 27, 2012. Webcam overlooks Biscuit Basin in YNP.
YVO Webcam, October 27, 2012. Webcam overlooks Biscuit Basin in Yellowstone National Park.
YVO Webcam, October 27, 2012. Webcam overlooks Biscuit Basin in Yellowstone National Park.

Huckleberry Ridge Tuff fall deposits at Mount Everts, Yellowstone
View of ripples caused by wind winnowing of the Huckleberry Ridge Tuff fall deposits at Mount Everts. Other layers below show evidence for rain and hail landing with the falling ash. Scale in centimeters and inches.
View of ripples caused by wind winnowing of the Huckleberry Ridge Tuff fall deposits at Mount Everts. Other layers below show evidence for rain and hail landing with the falling ash. Scale in centimeters and inches.

View north along U.S. Route 20 from near Ashton, ID, at the margin of the Huckleberry Ridge Tuff in the distance
linkGoogle maps photo taken just north of Ashton, ID, along U.S. Route 20. The photo was taken looking north towards Island Park, ID. The forested ridge in the distance marks the margin of a caldera that formed 2.08 million years ago, when the Huckleberry Ridge Tuff erupted.

Mud Geyser, Yellowstone
Steam rises from the Mud Geyser fumarole on the northeast side of the Mud Volcano thermal area in Yellowstone National Park. Gas that discharges from Mud Geyser has the most magmatic character of any sampled feature in Yellowstone.
Steam rises from the Mud Geyser fumarole on the northeast side of the Mud Volcano thermal area in Yellowstone National Park. Gas that discharges from Mud Geyser has the most magmatic character of any sampled feature in Yellowstone.
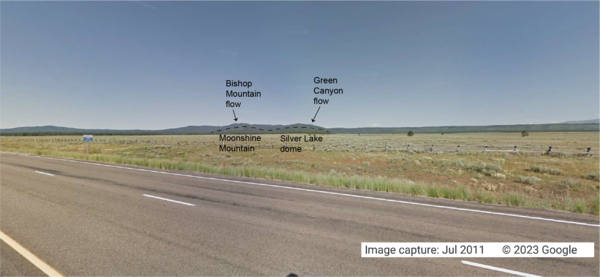
Looking west from the intersection of U.S. Route 20 and Old Hwy 47, in Idaho, at lava flows associated with the Henrys Fork caldera
linkGoogle Maps photo taken at the intersection of U.S. Route 20 and Old Hwy 47 in Idaho, looking west. The tops of Moonshine Mountain and Silver Lake dome, rhyolite lava flows located inside the caldera, are indicated with a dashed black line.

USGS employees deploys a water conductivity/temperature/depth probe...
USGS employees deploys a water conductivity/temperature/depth probe (AquaTroll) for a temporary study along the Madison River, Yellowstone.
USGS employees deploys a water conductivity/temperature/depth probe (AquaTroll) for a temporary study along the Madison River, Yellowstone.

Helicorder for Plate Boundary Observatory borehole seismometer B207...
Seismicity is shown for January 17, 2010 through the Feb 8, 2010. Borehole seismometer B207 is located about 7 miles (12 km) northeast of the 2010 swarm. Seismic data are provided by the National Science Foundation funded Plate Boundary Observatory operated by UNAVCO.
Seismicity is shown for January 17, 2010 through the Feb 8, 2010. Borehole seismometer B207 is located about 7 miles (12 km) northeast of the 2010 swarm. Seismic data are provided by the National Science Foundation funded Plate Boundary Observatory operated by UNAVCO.

YVO's mobile webcam system as deployed in Sep. 2010 near Lake Butte.
YVO's mobile webcam system as deployed in September 2010 near Lake Butte.
YVO's mobile webcam system as deployed in September 2010 near Lake Butte.

NPS inspects Plate Boundary Observatory strainmeter/seismometer
National Park Service employee inspects a Plate Boundary Observatory strainmeter/seismometer station.
National Park Service employee inspects a Plate Boundary Observatory strainmeter/seismometer station.

Cross section through the trunk of a Yellowstone lodgepole pine
Cross section through the trunk of a lodgepole pine tree from Cooking Hillside near Mud Volcano, Yellowstone National Park. The earliest date for this tree is 1916 and it died in 1990. Spongy white-gray areas are foam insulation that was injected into the sample to reinforce the structure of the wood.
Cross section through the trunk of a lodgepole pine tree from Cooking Hillside near Mud Volcano, Yellowstone National Park. The earliest date for this tree is 1916 and it died in 1990. Spongy white-gray areas are foam insulation that was injected into the sample to reinforce the structure of the wood.