
Need time to concentrate or relax? Then listen to the natural sounds of Kepler Cascades in Yellowstone National Park, Wyoming. Kepler Cascades is located just a couple miles away from Old Faithful within Yellowstone National Park, Wyoming.
Images
Images of Yellowstone.
Filter Total Items: 725

Kepler Cascades
Need time to concentrate or relax? Then listen to the natural sounds of Kepler Cascades in Yellowstone National Park, Wyoming. Kepler Cascades is located just a couple miles away from Old Faithful within Yellowstone National Park, Wyoming.

Mount Everts
Mount Everts, as seen from Mammoth Hot Springs near the North Entrance of Yellowstone National Park.
Mount Everts, as seen from Mammoth Hot Springs near the North Entrance of Yellowstone National Park.

Section of sediment core from Rush Lake, Lower Geyser Basin, Yellowstone National Park, showing different layers that accumulated over time
Section of sediment core from Rush Lake, Lower Geyser Basin, Yellowstone National Park, showing different layers that accumulated over timeSection of a sediment core from Rush Lake, Lower Geyser Basin, Yellowstone National Park.

GPS data from station P716, near Canyon Village, spanning 2005–2023
GPS data from station P716, near Canyon Village, spanning 2005–2023GPS data from station P716, near Canyon Village, spanning 2005–2023. Top plot shows motion in a north-south direction (positive change is north), middle is east-west motion (positive change is east), and bottom plot is up-down motion (positive change is up).

Eastern front of the Gallatin Range as viewed from Gardners Hole in Yellowstone National Park
Eastern front of the Gallatin Range as viewed from Gardners Hole in Yellowstone National ParkView to the southwest of the eastern front of the Gallatin Range from Gardners Hole. The East Gallatin-Reese Creek fault system runs along the base of the range at the prominent break-in-slope in the trees. Photo by James Mauch, Wyoming State Geological Survey, on August 29, 2023.

A portion of organic-rich lake mud recovered from Rush Lake, Lower Geyser Basin, Yellowstone National Park
A portion of organic-rich lake mud recovered from Rush Lake, Lower Geyser Basin, Yellowstone National ParkA portion of organic-rich lake mud recovered from Rush Lake, in the Lower Geyser Basin of Yellowstone National Park. Younger sediments are to the left and older sediments are to the right. The researcher is pointing to a thin, white layer—the Mazama ash, produced during the eruption 7600 years ago that formed Crater Lake in Oregon.
Sour Creek dome outcrop, Yellowstone National Park
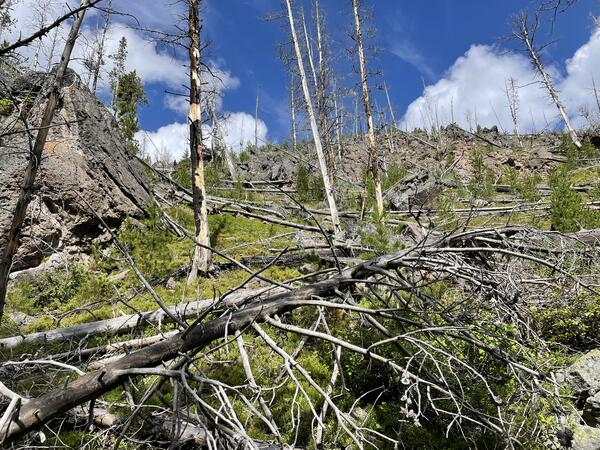
Sour Creek dome outcrop, Yellowstone National ParkExample rock outcrop in the Sour Creek dome area of Yellowstone National Park. The area is challenging to work in owing to occasionally boggy ground and abundant deadfall and dense lodgepole pine forests. Photo by Madison Myers, Montana State University, August 9, 2023.
Sour Creek dome outcrop, Yellowstone National Park
Sour Creek dome outcrop, Yellowstone National ParkExample rock outcrop in the Sour Creek dome area of Yellowstone National Park. The area is challenging to work in owing to occasionally boggy ground and abundant deadfall and dense lodgepole pine forests. Photo by Madison Myers, Montana State University, August 9, 2023.
Pouring cement for a footer of the new Yellowstone River Bridge
Pouring cement for a footer of the new Yellowstone River BridgePouring sulfate-resistant cement for one of the bridge footers after a drill hole has been completed. The existing bridge can be seen through the trees on the left side of the picture.

Drilling for the new Yellowstone River Bridge near Tower Junction
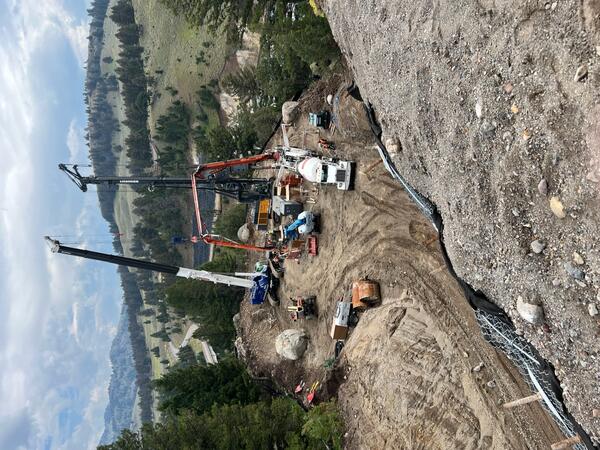
Drilling for the new Yellowstone River Bridge near Tower JunctionDrilling for the new Yellowstone River Bridge near Tower Junction. A small, yellow, personal 4-gas safety monitor can be seen on the upper left breast pocket on the person in the far right of the picture. Photo by Ken Sims (University of Wyoming), August 3, 2023.
Drilling for the new Yellowstone River Bridge near Tower Junction
Drilling for the new Yellowstone River Bridge near Tower JunctionDrilling for the new Yellowstone River Bridge near Tower Junction. A small, yellow, personal 4-gas safety monitor can be seen on the upper left breast pocket on the person in the far right of the picture. Photo by Ken Sims (University of Wyoming), August 3, 2023.

Devil’s Slide, Montana, looking across the Yellowstone River
Devil’s Slide, Montana, looking across the Yellowstone RiverPhoto of Devil’s Slide, Montana, looking across the Yellowstone River. The red streak is a Triassic shale layer. Rocks to the right of the streak are older and to the left are younger. USGS photo by Mike Poland, August 2, 2023.

Streamgage site and profiling tool on the Yellowstone River at Corwin Springs, Montana
Streamgage site and profiling tool on the Yellowstone River at Corwin Springs, MontanaStreamgage site and profiling tool on the Yellowstone River at Corwin Springs, Montana. The gage house narrowly avoided damage during the June 2022 flood, which eroded the downstream bank. The river profiling instrument helps to map the river bottom to assess streamflow rates and conditions. USGS photo by Mike Poland, July 31, 2023.

Map of Norris Geyser Basin
Map of Norris Geyser Basin showing the locations of major subbasins, roads and trails, and Nuphar Lake.
Map of Norris Geyser Basin showing the locations of major subbasins, roads and trails, and Nuphar Lake.

High-resolution satellite images of the Porcelain Basin and Nuphar Lake areas of Norris Geyser Basin
High-resolution satellite images of the Porcelain Basin and Nuphar Lake areas of Norris Geyser BasinHigh-resolution satellite images of the Porcelain Basin and Nuphar Lake areas of Norris Geyser Basin acquired by Quickbird-2 on September 11, 2006 (left), WorldView-3 on July 7, 2016 (middle), and WorldView-3 on March 30, 2022 (right). Note the change in color of Nuphar lake, from deep green to light blue, over time, as well as the increased evidence of flow f

Schematic model of Yellowstone’s subsurface magmatic sill complex based on seismic data collected in 2020
Schematic model of Yellowstone’s subsurface magmatic sill complex based on seismic data collected in 2020Schematic model of Yellowstone’s subsurface magmatic sill complex based on seismic data collected in 2020.

Velocity structures outlining the Yellowstone’s upper-crustal magma reservoir based on sparse (left) and dense (right) seismic networks
Velocity structures outlining the Yellowstone’s upper-crustal magma reservoir based on sparse (left) and dense (right) seismic networksComparison between the velocity structures outlining the Yellowstone’s upper-crustal magma reservoir at 5 km (3 mi) depth based on sparse (left) and dense (right) seismic networks. The open squares denote the locations of seismic sensors. Warmer color indicates lower velocity, representing higher melt fraction within the medium.

Animated GIF of the Porcelain Basin and Nuphar Lake areas of Norris Geyser Basin
Animated GIF of the Porcelain Basin and Nuphar Lake areas of Norris Geyser BasinHigh-resolution satellite images of the Porcelain Basin and Nuphar Lake areas of Norris Geyser Basin acquired by Quickbird-2 on September 11, 2006 and WorldView-3 on March 30, 2022. Note the change in color of Nuphar lake, from deep green to light blue, over time, as well as the increased evidence of flow from thermal features on the east side of Porcelain Bas

Map of Yellowstone region showing the backbone and dense 2020 seismic networks
Map of Yellowstone region showing the backbone and dense 2020 seismic networksMap of Yellowstone region showing the backbone (triangles) and dense 2020 (yellow squares) seismic networks, and based on Wu et al. (2023).
Map of Yellowstone region showing the backbone and dense 2020 seismic networks
Map of Yellowstone region showing the backbone and dense 2020 seismic networksMap of Yellowstone region showing the backbone (triangles) and dense 2020 (yellow squares) seismic networks, and based on Wu et al. (2023).

Four examples of vertical ground shaking during Steamboat Geyser eruptions as recorded by seismic station YNM
Four examples of vertical ground shaking during Steamboat Geyser eruptions as recorded by seismic station YNMFour examples of vertical ground shaking during Steamboat Geyser eruptions as recorded by seismic station YNM. The vertical scale is the same for each seismogram.

Visible (top) and thermal (bottom) images of Porcelain Basin
Visible (top) and thermal (bottom) images of Porcelain BasinVisible (top) and thermal (bottom) images of Porcelain Basin looking to the north from the old roadbed. Nuphar Lake is off the photograph to the right. Cool-water seeps into Porcelain Basin are clearly evident in the thermal image and appear to flow underground from Nuphar Lake. USGS photos by Mike Poland, July 1, 2023.

Earthquake Lake and the Madison slide
Earthquake Lake, which formed when the Madison River was blocked by a landslide that occurred as a consequence of the Hebgen Lake earthquake in 1959. The lake inundated existing forest, now marked by standing dead trees in the lake water. The landslide scar is visible on the side of the mountain at the far end of the lake.
Earthquake Lake, which formed when the Madison River was blocked by a landslide that occurred as a consequence of the Hebgen Lake earthquake in 1959. The lake inundated existing forest, now marked by standing dead trees in the lake water. The landslide scar is visible on the side of the mountain at the far end of the lake.

Map of Geyser Hill, Upper Geyser Basin, Yellowstone National Park, with selected thermal features
Map of Geyser Hill, Upper Geyser Basin, Yellowstone National Park, with selected thermal featuresMap of Geyser Hill, Upper Geyser Basin, Yellowstone National Park, showing selected thermal features, including new and reactivated features that were active during the May-June 2023 thermal unrest. Map prepared by by Kiernan Folz-Donahue, Yellowstone National Park.