High-resolution Planet satellite image of Biscuit Basin, Yellowstone National Park, from July 24, 2024
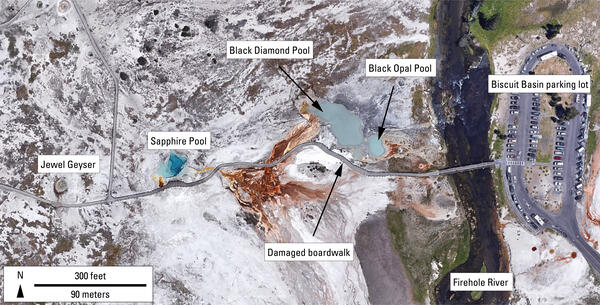
High-resolution Planet satellite image of Biscuit Basin, Yellowstone National Park, from July 24, 2024High-resolution Planet satellite image of Biscuit Basin, Yellowstone National Park, from July 24, 2024. The image shows changes that occurred as a result of the July 23, 2024, hydrothermal explosion from Black Diamond Pool, including deposition of material in the vicinity of the pool and a plume of discolored water in the Forehole River.