
Rock Drought Barrier on West False River, near Frank's Tract in California's Sacramento-San Joaquin Delta.
Images
California Water Science Center Images
Filter Total Items: 315

Rock Drought Barrier on West False River
Rock Drought Barrier on West False River, near Frank's Tract in California's Sacramento-San Joaquin Delta.

various matrices sampled and how bees might be exposed to pesticides
various matrices sampled and how bees might be exposed to pesticidesInfo graphic showing the various matrices sampled for this project and how bees might be exposed to pesticides.
various matrices sampled and how bees might be exposed to pesticides
various matrices sampled and how bees might be exposed to pesticidesInfo graphic showing the various matrices sampled for this project and how bees might be exposed to pesticides.

Research boat next to a dock at Clear lake, CA
Photo showing a harmful algal bloom (also known as “blue algae”) on the surface of Clear Lake. Photo by Nick Framsted, UC Davis.
Photo showing a harmful algal bloom (also known as “blue algae”) on the surface of Clear Lake. Photo by Nick Framsted, UC Davis.

Bee on wildflower
Bees gathering pollen on a wildflower near an agricultural location in Northern California.
Bees gathering pollen on a wildflower near an agricultural location in Northern California.

white-slough-restoration.png
Methods of addressing problems of subsidence and increasing carbon storage at White Slough include: 1] reuse of sediment to fill subsided areas and restore elevations that support marsh vegetation (left), and 2] breaching historic dikes in order to restore tidal hydrology (right).
Methods of addressing problems of subsidence and increasing carbon storage at White Slough include: 1] reuse of sediment to fill subsided areas and restore elevations that support marsh vegetation (left), and 2] breaching historic dikes in order to restore tidal hydrology (right).
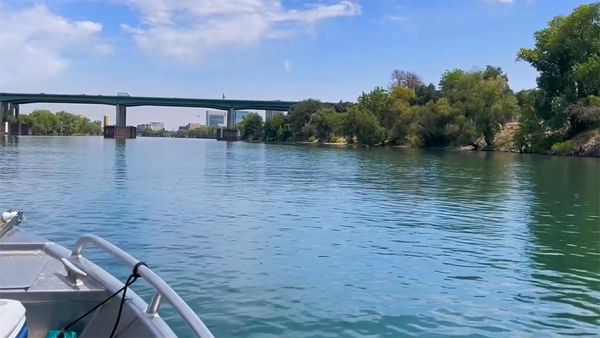
Boat Near Sacramento
The USGS research vessel George R. Aiken under the I-80 overpass near Sacramento, CA.
The USGS research vessel George R. Aiken under the I-80 overpass near Sacramento, CA.

breaching-humbolt-dike.png
Backhoe being used to breach historic dike in order to restore tidal hydrology at White Slough Unit.
Backhoe being used to breach historic dike in order to restore tidal hydrology at White Slough Unit.

drifter with high-precision receiver to capture flow speeds
drifter with high-precision receiver to capture flow speedsKeswick Reservoir, on the Sacramento River near Redding, receives both water and contaminants via outflow from an upstream dam. Information is needed on dilution rates and how these vary with hydrological/meteorological forcing and reservoir management.

reusing-sediment-humbolt.png
Beneficial re-use of sediment to fill subsided areas and restore elevations that support marsh vegetation at White Slough Unit.
Beneficial re-use of sediment to fill subsided areas and restore elevations that support marsh vegetation at White Slough Unit.

CochellaValley_dead_vines.jpg
Distressed vineyard in Coachella Valley, Calif. Picture taken by Kelly M. Grow of the California Department of Water Resources.
Distressed vineyard in Coachella Valley, Calif. Picture taken by Kelly M. Grow of the California Department of Water Resources.

Folsom_2021drought.jpg
Low water drought conditions at Folsom Lake, California, on June 23, 2021. Photo by Florence Low / California Department of Water Resources.
Low water drought conditions at Folsom Lake, California, on June 23, 2021. Photo by Florence Low / California Department of Water Resources.

Oroville_2021drought.jpg
Lake Oroville showing extremely low water under the Enterprise Bridge during 2021 drought. Photo by Kelly M. Grow of the California Department of Water Resources.
Lake Oroville showing extremely low water under the Enterprise Bridge during 2021 drought. Photo by Kelly M. Grow of the California Department of Water Resources.

FL_Griffith_Park-drought.jpg
Dying trees at Griffith Park in Los Angeles, California. Photo by Florence Low / California Department of Water Resources.
Dying trees at Griffith Park in Los Angeles, California. Photo by Florence Low / California Department of Water Resources.

Pepperwood-USGS-Black Swift Team with Super Swift UAS
Pepperwood-USGS-Black Swift Team with Super Swift UASPepperwood-USGS-Black Swift Team with Super Swift UAS prior to launch, Pepperwood Preserve, Sonoma County, California. Left-to-right: Jack Elston, Michelle Stern, Maciej Stachura, Ryan Ferrell.

Soil Moisture Sampling
Ryan Ferrell (Pepperwood Preserve) collecting field soil moisture data using a HydroSenseII Time Domain Reflectometry (TDR) probe and soil cores to validate remotely sensed soil moisture.
Ryan Ferrell (Pepperwood Preserve) collecting field soil moisture data using a HydroSenseII Time Domain Reflectometry (TDR) probe and soil cores to validate remotely sensed soil moisture.

UAS Equipped with Remote Sensing Technology
Working with the USGS and Pepperwood Preserve, Black Swift Technologies LLC deployed radiometers on a UAS, the Super Swift (S2).
Working with the USGS and Pepperwood Preserve, Black Swift Technologies LLC deployed radiometers on a UAS, the Super Swift (S2).

Real-time Monitoring Station
Real-time monitoring station on the Pepperwood Preserve, Sonoma County, CA. This station measures precipitation, air temperature, humidity, wind speed and direction, soil moisture, electric conductivity, and soil temperature.
Real-time monitoring station on the Pepperwood Preserve, Sonoma County, CA. This station measures precipitation, air temperature, humidity, wind speed and direction, soil moisture, electric conductivity, and soil temperature.

Los Angeles Coastal Plain Groundwater-flow Model
Complex aquifer system simulated in the Los Angeles Coastal Plain, California.
Complex aquifer system simulated in the Los Angeles Coastal Plain, California.

The Mojave River: A 3D Journey
The Mojave River is the largest of the streams and rivers that flow through southwestern San Bernardino County, CA. It extends more than 100 miles east from its source in the San Bernardino Mountains to the end east of Afton Canyon. This 3D animation takes the viewer on a tour of the entire length of the river.
The Mojave River is the largest of the streams and rivers that flow through southwestern San Bernardino County, CA. It extends more than 100 miles east from its source in the San Bernardino Mountains to the end east of Afton Canyon. This 3D animation takes the viewer on a tour of the entire length of the river.

Sampling for Clear Lake Hitch
The Clear Lake Hitch was formerly highly abundant and a staple food for the Pomo tribes of the Clear Lake region. The original abundance of this fish species is unknown but is believed to have declined 100-fold.
The Clear Lake Hitch was formerly highly abundant and a staple food for the Pomo tribes of the Clear Lake region. The original abundance of this fish species is unknown but is believed to have declined 100-fold.

Scientists aboard research vessel conduct water-quality mapping
Scientists aboard research vessel conduct water-quality mappingScientists aboard R/V Aiken conduct water-quality mapping in support of wastewater-derived nutrients project
Scientists aboard research vessel conduct water-quality mapping
Scientists aboard research vessel conduct water-quality mappingScientists aboard R/V Aiken conduct water-quality mapping in support of wastewater-derived nutrients project