
Figure 1: A structure (water treatment intake?) on southern Lake Almanor, with area burned by the Dixie Fire (2021) in the background. Photo: Maura Uebner (USGS)
Images
California Water Science Center Images
Filter Total Items: 315

A structure on southern Lake Almanor, CA.
Figure 1: A structure (water treatment intake?) on southern Lake Almanor, with area burned by the Dixie Fire (2021) in the background. Photo: Maura Uebner (USGS)

An area burned by the 2020 North Complex on the Middle Fork arm of Lake Oroville, CA.
An area burned by the 2020 North Complex on the Middle Fork arm of Lake Oroville, CA.Figure 2: An area burned at high intensity by the North Complex (2020) on the Middle Fork arm of Lake Oroville, CA. Photo: Maura Uebner (USGS)

Tarah Balden, scientist, Yurok Tribe looking at data logger
Tarah Balden, scientist, Yurok Tribe looking at data loggerA soil moisture data logger buried in the ground is a specialized instrument designed to measure and record the moisture content of soil over time. Here's how it generally functions:

Scientists collecting radiance measurements
Figure 3: Maura Uebner (USGS) collecting radiance measurements using an SVC 512i on Pardee Reservoir, CA. Photo: Tommy Ly (USGS)
Figure 3: Maura Uebner (USGS) collecting radiance measurements using an SVC 512i on Pardee Reservoir, CA. Photo: Tommy Ly (USGS)

Scientists collect discrete water quality samples on Folsom Lake, CA
Scientists collect discrete water quality samples on Folsom Lake, CATommy Ly (foreground; USGS) and Jake Brinkman (background; USGS) preparing to collect discrete water quality samples on Folsom Lake. Photo: Maura Uebner (USGS).
Scientists collect discrete water quality samples on Folsom Lake, CA
Scientists collect discrete water quality samples on Folsom Lake, CATommy Ly (foreground; USGS) and Jake Brinkman (background; USGS) preparing to collect discrete water quality samples on Folsom Lake. Photo: Maura Uebner (USGS).

Joe Hostler, environmental scientist, Yurok Tribe installing soil moisture probe
Joe Hostler, environmental scientist, Yurok Tribe installing soil moisture probeThe U.S. Geological Survey (USGS) often employs specific types of soil moisture probes to monitor watersheds, creeks, and streams as part of their hydrological studies and environmental monitoring efforts.

booth-pic.jpg
USGS booth at fall 2023 Association of California Water Agencies (ACWA) conference in Indian Wells, California.
USGS booth at fall 2023 Association of California Water Agencies (ACWA) conference in Indian Wells, California.

banner.jpg
Banner graphic for fall 2023 ACWA conference held in Indian Wells, California.
Banner graphic for fall 2023 ACWA conference held in Indian Wells, California.

booth-team.jpg
The CAWSC ACWA Conference team included (L to R): Steve Ackley, Elizabeth Jachens, Anke Mueller-Solger, John "Izzy" Izbicki, Bryant Jurgens, and Claudia Faunt
The CAWSC ACWA Conference team included (L to R): Steve Ackley, Elizabeth Jachens, Anke Mueller-Solger, John "Izzy" Izbicki, Bryant Jurgens, and Claudia Faunt

izzy.jpg
Dr. John Izbicki discusses research with an Association of California Water Agencies (ACWA) conference attendee.
Dr. John Izbicki discusses research with an Association of California Water Agencies (ACWA) conference attendee.

Dr. John Izbicki discusses differences in local geology within the groundwater aquifer with Hinkley residents.
Dr. John Izbicki discusses differences in local geology within the groundwater aquifer with Hinkley residents.Dr. John Izbicki (seated) discusses differences in local geology within the groundwater aquifer with Hinkley residents. This took place at a meeting in Sacramento to discuss the development of MODFLOW Model.

Additional analyses at a USGS lab in Menlo Park
Additional analyses at a USGS lab in Menlo Park were also conducted, but not before the Technical Advisory Committee was given a tour of the USGS and an explanation of all that is entailed. In this photo, a USGS scientist explains data from the mobile laboratory to members of the Hinkley community.
Additional analyses at a USGS lab in Menlo Park were also conducted, but not before the Technical Advisory Committee was given a tour of the USGS and an explanation of all that is entailed. In this photo, a USGS scientist explains data from the mobile laboratory to members of the Hinkley community.

The USGS mobile lab being used to carry out on-site sample analyses.
The USGS mobile lab being used to carry out on-site sample analyses.Researchers from the USGS use a mobile lab to carry out on-site sample analyses near Hinkley, CA.
The USGS mobile lab being used to carry out on-site sample analyses.
The USGS mobile lab being used to carry out on-site sample analyses.Researchers from the USGS use a mobile lab to carry out on-site sample analyses near Hinkley, CA.

USGS researchers discuss Menlo Park lab analysis
USGS researchers discuss Menlo Park lab analysis details with representatives from the Technical Advisory Committee.
USGS researchers discuss Menlo Park lab analysis details with representatives from the Technical Advisory Committee.

USGS researcher meets with Hinkley resident to discuss the day's work.
USGS researcher meets with Hinkley resident to discuss the day's work.A USGS scientist meets with a Hinkley resident at research site to discuss the details of a geophysical survey.
USGS researcher meets with Hinkley resident to discuss the day's work.
USGS researcher meets with Hinkley resident to discuss the day's work.A USGS scientist meets with a Hinkley resident at research site to discuss the details of a geophysical survey.

Citrus orchard and canal in California's Coachella-Valley
Citrus orchard and canal in California's Coachella-ValleyThis is a photograph of a Citrus orchard and canal in California's Coachella-Valley.
Citrus orchard and canal in California's Coachella-Valley
Citrus orchard and canal in California's Coachella-ValleyThis is a photograph of a Citrus orchard and canal in California's Coachella-Valley.

USGS Youth Outreach at Expanding Your Horizons Conference
USGS Youth Outreach at Expanding Your Horizons ConferenceElisabeth LaBarbera, Andrea Jaegge, Nick Framsted, and Schuyler Nardelli hosted a workshop for the Expanding Your Horizons Conference. During lunchtime networking, Anna Conlen and Lawrence Fujiwara from the West Sacramento Projects Office hosted a USGS table where the girls were able to learn all about a future career with the USGS.

Dive into the Bay-Delta - 2
One part of the “Dive into the Bay Delta” workshop involved using Skittles to help demonstrate the concept of chromatography. Here, Elisabeth LaBarbera pours hot water over the Skittles and students observe how the running colors form a pattern.
One part of the “Dive into the Bay Delta” workshop involved using Skittles to help demonstrate the concept of chromatography. Here, Elisabeth LaBarbera pours hot water over the Skittles and students observe how the running colors form a pattern.

Dive into the Bay-Delta - 1
The USGS workshop called “Dive into the Bay-Delta” featured chromatography, microscopy, and sediment cores. Here USGS workshop leaders assist students with their hands-on activity.
The USGS workshop called “Dive into the Bay-Delta” featured chromatography, microscopy, and sediment cores. Here USGS workshop leaders assist students with their hands-on activity.

USGS volunteers talk to student at careers table.
During lunchtime networking, Anna Conlen and Lawrence Fujiwara from the West Sacramento Projects Office hosted a USGS table where the girls were able to learn all about a future career with the USGS.
During lunchtime networking, Anna Conlen and Lawrence Fujiwara from the West Sacramento Projects Office hosted a USGS table where the girls were able to learn all about a future career with the USGS.
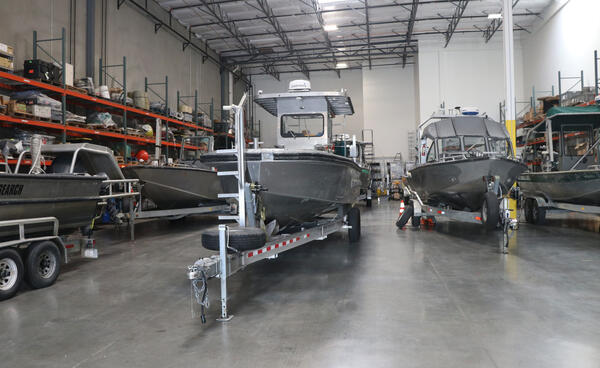
The boat warehouse at the CAWSC West Sacramento Projects Office.
The boat warehouse at the CAWSC West Sacramento Projects Office.The boat warehouse at the CAWSC West Sacramento Projects Office.
The boat warehouse at the CAWSC West Sacramento Projects Office.
The boat warehouse at the CAWSC West Sacramento Projects Office.The boat warehouse at the CAWSC West Sacramento Projects Office.