
Pictured are a few of the 2023 CAWSC poster presenters: (from L to R) Danielle Palm, Matthew Uychutin, and Andrea Jaegge.
Images
California Water Science Center Images
Filter Total Items: 315

2023 CAWSC poster presenters
Pictured are a few of the 2023 CAWSC poster presenters: (from L to R) Danielle Palm, Matthew Uychutin, and Andrea Jaegge.
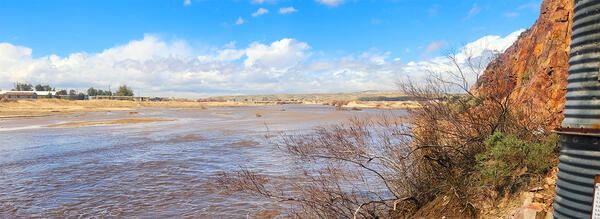
Mojave River near gage - MOJAVE R A BARSTOW 10262500
Mojave River near gage - MOJAVE R A BARSTOW 10262500Mojave River near gage - MOJAVE R A BARSTOW 10262500. Photo taken by Mike Lee, USGS supervisory hydrologist in the southwest region.
Mojave River near gage - MOJAVE R A BARSTOW 10262500
Mojave River near gage - MOJAVE R A BARSTOW 10262500Mojave River near gage - MOJAVE R A BARSTOW 10262500. Photo taken by Mike Lee, USGS supervisory hydrologist in the southwest region.

Map of Feather watershed with SMRUs
Figure 1. Upper Feather River watershed showing 15 different soil moisture response units (SMRU) proposed sites of soil moisture monitoring stations (2 proposed sites for each SMRU).
Figure 1. Upper Feather River watershed showing 15 different soil moisture response units (SMRU) proposed sites of soil moisture monitoring stations (2 proposed sites for each SMRU).

Map of wildfires in Feather River watershed
Figure 4. Map of the upper Feather River watershed showing outlines of two of the largest wildfires in the basin from recent years: North Complex Fire in 2020 and Dixie Fire in 2021.
Figure 4. Map of the upper Feather River watershed showing outlines of two of the largest wildfires in the basin from recent years: North Complex Fire in 2020 and Dixie Fire in 2021.

Excess Water Flows out of California
Nine consecutive rainstorms have poured on California since December 26, 2022, after three years of intensive drought.
Nine consecutive rainstorms have poured on California since December 26, 2022, after three years of intensive drought.

High streamflow measured across California during New Year's storm
High streamflow measured across California during New Year's stormAt atmospheric river brought heavy precipitation to California from December 31, 2022 through January 2, 2023. USGS crews took 77 measurements at 58 sites across the state, with northern California being hardest hit. This map shows where some of the highest streamflow occurred. Data are provisional and subject to revision.

High water mark on streamgage 11161000 San-Lorenzo-River Santa-Cruz
High water mark on streamgage 11161000 San-Lorenzo-River Santa-CruzSharon Mulready, USGS Hydrologic Technician, recording the high-water mark on gage 11161000 San Lorenzo River Santa Cruz. The stream is filled with a tremendous amount of sediment moved by the storm on December 31st, 2022.

Alameda Creek, California
High water on Alameda Creek, California. Taken at Alameda Diversion Dam near Sunol, CA.
High water on Alameda Creek, California. Taken at Alameda Diversion Dam near Sunol, CA.

Soil moisture sensors installed in a soil moisture monitoring pit as part of a USGS monitoring station for real-time soil moisture monitoring. Photo credit: Michelle Stern, USGS
Soil moisture sensors installed in a soil moisture monitoring pit as part of a USGS monitoring station for real-time soil moisture monitoring. Photo credit: Michelle Stern, USGSFigure 5. Soil moisture sensors installed in a soil moisture monitoring pit as part of a USGS monitoring station for real-time soil moisture monitoring. Photo credit: Michelle Stern, USGS.
Soil moisture sensors installed in a soil moisture monitoring pit as part of a USGS monitoring station for real-time soil moisture monitoring. Photo credit: Michelle Stern, USGS
Soil moisture sensors installed in a soil moisture monitoring pit as part of a USGS monitoring station for real-time soil moisture monitoring. Photo credit: Michelle Stern, USGSSoil moisture sensors installed in a soil moisture monitoring pit as part of a USGS monitoring station for real-time soil moisture monitoring. Photo credit: Michelle Stern, USGS
Soil moisture sensors installed in a soil moisture monitoring pit as part of a USGS monitoring station for real-time soil moisture monitoring. Photo credit: Michelle Stern, USGSFigure 5. Soil moisture sensors installed in a soil moisture monitoring pit as part of a USGS monitoring station for real-time soil moisture monitoring. Photo credit: Michelle Stern, USGS.

High flow at USGS streamgage 11172945 on Alameda Creek, California
High flow at USGS streamgage 11172945 on Alameda Creek, CaliforniaHigh flows at streamgage 11172945 (Alameda Creek above Div Dam near Sunol, California) were captured by USGS hydrologic technician Louis Cannarozzi on 12/31/2022. Heavy precipitation caused higher-than-normal streamflow in many areas as an atmospheric river moved through northern California.

Measuring record flows at streamgage 11335000 (Consumnes River at Michigan Bar, CA)
Measuring record flows at streamgage 11335000 (Consumnes River at Michigan Bar, CA)USGS hydrologic technician Travis Hiett measures streamflow using a truck mounted boom and price AA meter at the Cosumnes River at Michigan Bar, California on December 31, 2022. Travis captured the highest direct measurement ever recorded at this site—63,700 cubic feet per second—in over 100 years of record.

Record Flow, Streamgage 11335000 (Cosumnes River at Michigan Bar, CA)
Record Flow, Streamgage 11335000 (Cosumnes River at Michigan Bar, CA)The Consumes River experienced record streamflow over the 2022 New Year's holiday weekend as an atmospheric river moved through northern California. Crews captured the highest direct measurement ever recorded at this site—63,700 cubic feet per second—in over 100 years of record. (Credit: Susan Brockner, USGS. Public domain.)

Construction of one of the LoRa-cellular gateway antenna towers in the Feather River Watershed.
Construction of one of the LoRa-cellular gateway antenna towers in the Feather River Watershed.Photos during the construction of one of the LoRa-cellular gateway antenna towers in the Feather River Watershed.

MODFLOW-flow-chart.png
The MODFLOW-2005 framework branched into multiple specialized versions that are combined form the MODFLOW One-Water Hydrologic Flow Model (MF-OWHM).
The MODFLOW-2005 framework branched into multiple specialized versions that are combined form the MODFLOW One-Water Hydrologic Flow Model (MF-OWHM).

Principal aquifers and wells assessed in nationwide NAWQA/GAMA groundwater quality study
Principal aquifers and wells assessed in nationwide NAWQA/GAMA groundwater quality studyMap showing principal aquifers (PAs) and wells that were sampled as part of a Nationwide assessment of the quality of groundwater used for public supply.

Remotely sensed chlorophyll estimates during the 2022 HAB event.
Remotely sensed chlorophyll estimates during the 2022 HAB event.Remotely sensed chlorophyll estimates during the 2022 HAB event (mg m-3). Data are from the ESA Sentinel-3 satellite and are processed using a locally tuned algorithm for San Francisco Bay.
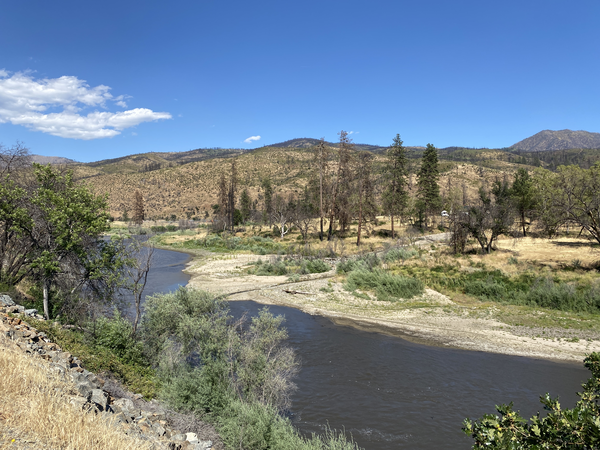
Post-Fire Landscape
The photo shows the Klamath River following the 2022 McKinney Fire, with burned areas visible along the distant ridgeline and a debris fan in the foreground near the confluence of Little Humbug Creek and the Klamath River. The photo documents sediment and debris deposited from burned landscapes into the river corridor following wildfire and storm runoff.
The photo shows the Klamath River following the 2022 McKinney Fire, with burned areas visible along the distant ridgeline and a debris fan in the foreground near the confluence of Little Humbug Creek and the Klamath River. The photo documents sediment and debris deposited from burned landscapes into the river corridor following wildfire and storm runoff.

trukee-webcam-wide.png
Webcam image and hydrograph from Truckee River webcam. Truckee River at Boca Bridge near Truckee, CA.
Webcam image and hydrograph from Truckee River webcam. Truckee River at Boca Bridge near Truckee, CA.

extensometer-talk.jpg
USGS scientist Michelle Sneed explaining the extensometer to group from the 2022 Water Education Foundation Central Valley Tour.
USGS scientist Michelle Sneed explaining the extensometer to group from the 2022 Water Education Foundation Central Valley Tour.

Kamahu’ehu’e Pond, Moloka’i, Hawai’i
Kamahu’ehu’e Pond is covered in non-native pickleweed on the southeast coast of Moloka’i, Hawai’i.
Kamahu’ehu’e Pond is covered in non-native pickleweed on the southeast coast of Moloka’i, Hawai’i.

bees on tree blossoms
Bees gathering pollen on tree blossoms near an agricultural location in Northern California.
Bees gathering pollen on tree blossoms near an agricultural location in Northern California.