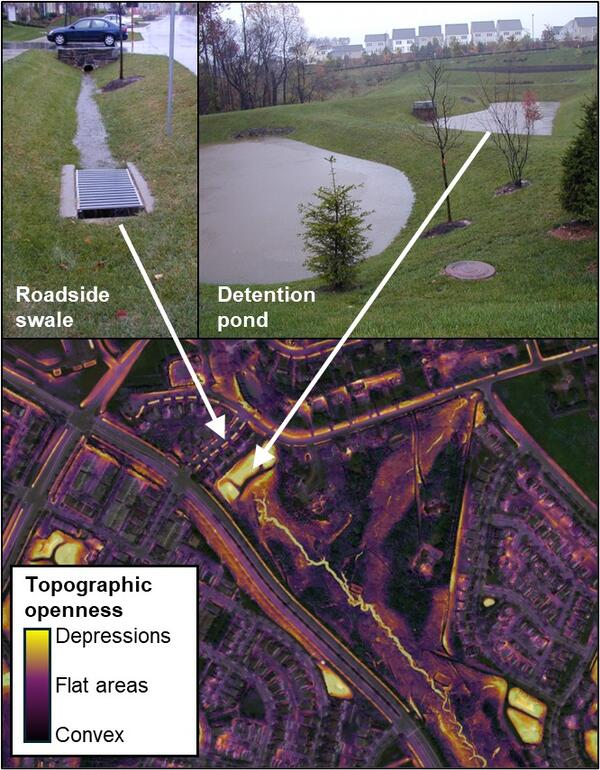
U.S. flag

An official website of the United States government

Images

Images from USGS Chesapeake Bay reports and field activities are available to visualize and help translate the science. They are available for your use, just please cite the USGS as the source of respective images.

Filter Total Items: 149
Collage of 5 close up photos of various species of field-collected freshwater fish displaying DELT
Various species of field-collected freshwater fish displaying DELT

Various species of field-collected freshwater fish displaying DELT, including A) an eroded fin, B) melanistic areas, C) parasitic leeches (black arrow) and black spots (trematode, white arrows), D) a cyst (on gill), and E) tumors.

Various species of field-collected freshwater fish displaying DELT, including A) an eroded fin, B) melanistic areas, C) parasitic leeches (black arrow) and black spots (trematode, white arrows), D) a cyst (on gill), and E) tumors.

Map of six colors depicting environment type and dots representing observations of DELT
Map of fish collection streams (n= 1,196) for 57 species within the Chesapeake Bay watershed

Fish collection streams (n= 1,196) for 57 species within the Chesapeake Bay watershed (black outline). Grey circles indicate the presence of observed DELT, and white circles indicate its absence, in at least one individual fish at each stream. Major land use and land cover were obtained from the Chesapeake Bay Program (2023).

Fish collection streams (n= 1,196) for 57 species within the Chesapeake Bay watershed (black outline). Grey circles indicate the presence of observed DELT, and white circles indicate its absence, in at least one individual fish at each stream. Major land use and land cover were obtained from the Chesapeake Bay Program (2023).

Three maps modeling submergence
Maps showing the predicted year of submergence for parts of the Eastern Neck Island National Wildlife Refuge

Maps showing the predicted year of submergence for parts of the Eastern Neck Island National Wildlife Refuge, as predicted by three different models under the same RSLR scenario.

Map of Potomac Watershed
Map showing predicted environmental concentrations (PEC) of PFAS in Potomac River watershed streams

Map showing predicted environmental concentrations (PEC) of PFAS in Potomac River watershed streams, where PFAS is represented as the summed concentration of eight PFAS found in wastewater treatment plant discharges, in nanograms per liter (ng/L).

Conceptual diagram of the measurement and modeling approaches used in this study

Conceptual diagram of the measurement and modeling approaches used in this study. ΣPFAS (ng/L), summed concentration of PFAS in nanograms per liter.

Map of the Chesapeake Bay Nontidal Network showing suspended sediment trends and changes in flow-normalized load, 2014-2023
Chesapeake Bay Nontidal Network: 2014-2023 Suspended Sediment 10-year Trends and Percent Change in Flow-normalized Loads

This map displays the 10-year trend for suspended sediment, as well as the percent total change in flow-normalized loads for suspended sediment across the Chesapeake Bay Watershed from 2014 to 2023. 

Map of the Chesapeake Bay Nontidal Network showing Total Nitrogen trends and changes in flow-normalized yield, 2014-2023
Chesapeake Bay Nontidal Network: 2014-2023 Total Nitrogen 10-year Trends and Change in Flow-normalized Per Acre Loads
Map of the Chesapeake Bay Nontidal Network showing Total inorganic N trends and changes in flow-normalized yield, 2014-2023
Chesapeake Bay Nontidal Network: 2014-2023 Total Nitrate + Nitrate 10-year Trends and Change in Flow-normalized Per Acre Loads

This map displays the 10-year trend for total nitrate + nitrogen (also known as inorganic nitrogen), as well as the total change in flow-normalized loads per acre for total nitrate + nitrite across the Chesapeake Bay Watershed from 2014 to 2023. 

Map of the Chesapeake Bay Nontidal Network showing Orthophosphate trends and changes in flow-normalized yield, 2014-2023
Chesapeake Bay Nontidal Network: 2014-2023 Orthophosphate 10-year Trends and Change in Flow-normalized Per Acre Loads

This map displays the 10-year trend for orthophosphate, as well as the total change in flow-normalized loads per acre for orthophosphate across the Chesapeake Bay Watershed from 2014 to 2023. 

Map of the Chesapeake Bay Nontidal Network showing suspended sediment trends and changes in flow-normalized yield, 2014-2023
Chesapeake Bay Nontidal Network: 2014-2023 Suspended Sediment 10-year Trends and Change in Flow-normalized Per Acre Loads
Map of the Chesapeake Bay Nontidal Network showing inorganic N long term trend and change in flow-normalized per acre load
Chesapeake Bay Nontidal Network: 1985-2023 Nitrate + Nitrite Trends and Change in Flow-Normalized Per Acre Load

This map displays the long-term trend for nitrate + nitrite, also known as inorganic nitrogen, as well as the total change in flow-normalized per-acre loads for nitrate + nitrite across the Chesapeake Bay Watershed from 1985 to 2023. 

Map of the Chesapeake Bay Nontidal Network showing Total P long term trend and change in flow-normalized per acre load
Chesapeake Bay Nontidal Network: 1985-2023 Total Phosphorus Trends and Change in Flow-Normalized Per Acre Load

This map displays the long-term trend for total phosphorus, as well as the total change in flow-normalized per-acre loads for total phosphorus across the Chesapeake Bay Watershed from 1985 to 2023. 

Map of the Chesapeake Bay Nontidal Network showing Nitrate + Nitrite Average 5-year Yield from 2019-2023
Chesapeake Bay Nontidal Network: 2019-2023 Nitrate + Nitrite Average 5-year Per-Acre Load

This map displays the average 5-year per acre loads, also known as yields, of nitrate + nitrite, also known as total inorganic nitrogen, across the Chesapeake Bay Watershed from 2019 to 2023. 

Map of the Chesapeake Bay Nontidal Network showing Total Nitrogen trends and changes in flow-normalized load, 2014-2023
Chesapeake Bay Nontidal Network: 2014-2023 Total Nitrogen 10-year Trends and Percent Change in Flow-normalized Loads
Map of the Chesapeake Bay Nontidal Network showing Suspended Sediment Average trend and 10-year yield from 2014-2023
Chesapeake Bay Nontidal Network: 2014-2023 Suspended Sediment 10-year Trend and Per-Acre Load

This map displays the average 10-year trends and per acre loads, also known as yields, of suspended sediment across the Chesapeake Bay Watershed from 2014 to 2023. 

Map of the Chesapeake Bay Nontidal Network showing Total P long term trends and percent change in flow-normalized load
Chesapeake Bay Nontidal Network: 1985-2023 Total Phosphorus Trends and Percent Change in Flow-Normalized Load

This map displays the long term trend for total phosphorus, as well as the percent total change in flow-normalized loads for total phosphorus across the Chesapeake Bay Watershed from 1985 to 2023. 

Map of the Chesapeake Bay Nontidal Network showing suspended sediment long term trends and %change in flow-normalized load
Chesapeake Bay Nontidal Network: 1985-2023 Suspended Sediment Trends and Percent Change in Flow-Normalized Load

This map displays the long term trend for suspended sediment, as well as the percent total change in flow-normalized loads for suspended sediment across the Chesapeake Bay Watershed from 1985 to 2023. 

Map of the Chesapeake Bay Nontidal Network showing Total Nitrogen long term trend and change in flow-normalized per acre load
Chesapeake Bay Nontidal Network: 1985-2023 Total Nitrogen Trends and Change in Flow-Normalized Per Acre Load

This map displays the long-term trend for total nitrogen, as well as the total change in flow-normalized per-acre loads for total nitrogen across the Chesapeake Bay Watershed from 1985 to 2023. 

Was this page helpful?