U.S. flag

An official website of the United States government

Images

Images from USGS Chesapeake Bay reports and field activities are available to visualize and help translate the science. They are available for your use, just please cite the USGS as the source of respective images.

Filter Total Items: 149
Map of the Chesapeake Bay Nontidal Network showing Total Phosphorus trends and changes in flow-normalized yield, 2014-2023
Chesapeake Bay Nontidal Network: 2014-2023 Total Phosphorus 10-year Trends and Change in Flow-normalized Per Acre Loads

This map displays the 10-year trend for total phosphorus, as well as the total change in flow-normalized loads per acre for total phosphorus across the Chesapeake Bay Watershed from 2014 to 2023. 

Map of the Chesapeake Bay Nontidal Network showing Nitrate + Nitrite Average 10-year yield from 2014-2023
Chesapeake Bay Nontidal Network: 2014-2023 Nitrate + Nitrite Average 10-year Per-Acre Load

This map displays the average 10-year per acre loads, also known as yields, of nitrate + nitrite, also known as inorganic nitrogen, across the Chesapeake Bay Watershed from 2014 to 2023. 

Map of the Chesapeake Bay Nontidal Network showing inorganic N long term trends and percent change in flow-normalized load
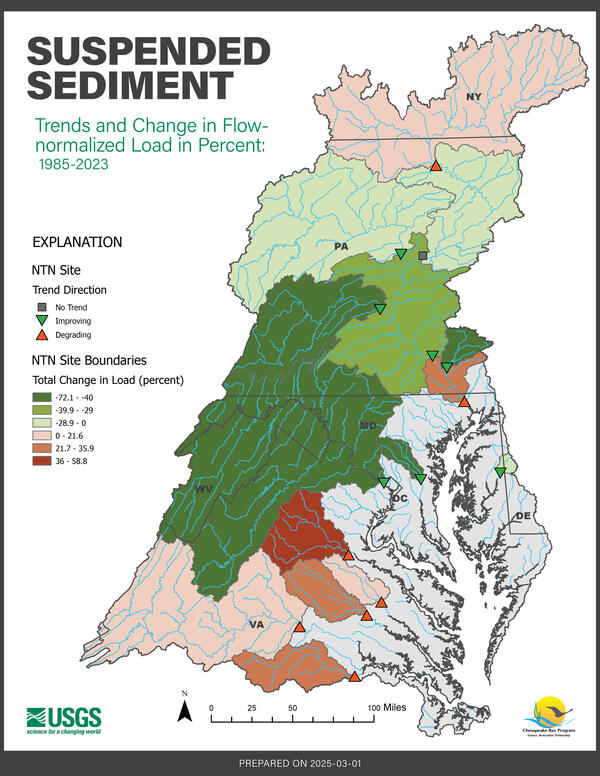
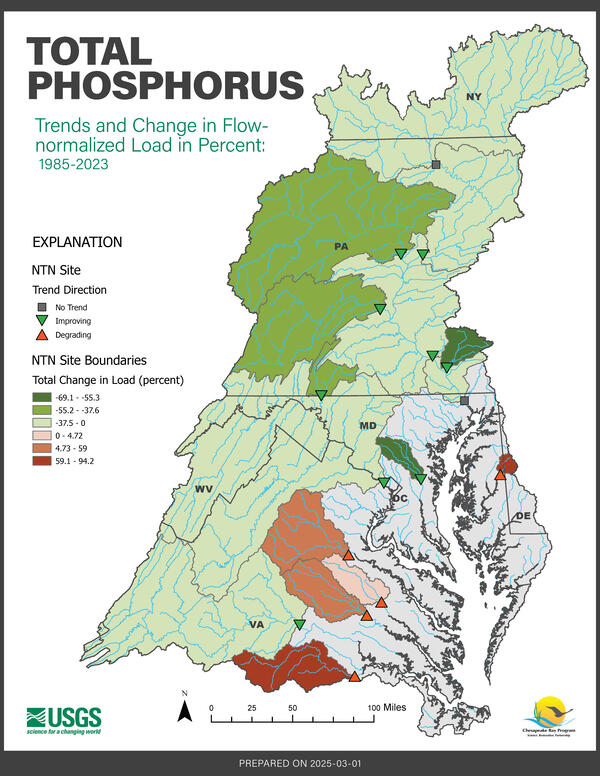
Chesapeake Bay Nontidal Network: 1985-2023 Nitrate + Nitrite Trends and Percent Change in Flow-Normalized Load

This map displays the long-term trend for nitrate + nitrite, also known as inorganic nitrogen, as well as the percent total change in flow-normalized loads for nitrate + nitrite across the Chesapeake Bay Watershed from 1985 to 2023. 

View of the Susquehanna River from just above water level, with trees covering both banks.
The Susquehanna River

View of the Susquehanna River, the longest river on the east coast of the United States.

View of the Susquehanna River, the longest river on the east coast of the United States.

Two maps of Chesapeake Bay watershed and line graph below maps. Left: Predicted median annual SC. Right: SC departure class.
Diagram showing predicted median annual specific conductance (SC) for all modeled stream reaches in the Chesapeake Bay watershed

(a) Predicted median annual specific conductance (SC) for all modeled stream reaches in the Chesapeake Bay watershed (CBW) for the 2014–2016 time period. (b) SC departure classes for the 2014–2016 time period. (c) Percent of the modeled CBW area in each of the departure classes over the four time periods.

Two researchers in life vests stand at a table full of water quality sampling equipment. They demonstrate its use.
Water Quality Sampling Equipment Show-and-Tell

USGS scientists Jimmy Webber and Dan Burns explain how water quality equipment is used to take measurements at War Branch and other monitoring stations.

USGS scientists Jimmy Webber and Dan Burns explain how water quality equipment is used to take measurements at War Branch and other monitoring stations.

15 people stand next to a bioreactor, a dam in a spring-fed creek made up of woodchips, soil, and straw.
Visit to the War Branch Bioreactor

Community partners tour the bioreactor at War Branch. 

The War Branch bioreactor was installed below a natural spring in the War Branch watershed. The USGS had previously measured elevated nitrate concentrations from this spring. 

Community partners tour the bioreactor at War Branch. 

The War Branch bioreactor was installed below a natural spring in the War Branch watershed. The USGS had previously measured elevated nitrate concentrations from this spring. 

Water flows out of a bioreactor through a white PVC pipe before splashing down into a small stream.
The War Branch Bioreactor

The War Branch bioreactor was installed below a natural spring in the War Branch watershed. The USGS had previously measured elevated nitrate concentrations from this spring. 

The War Branch bioreactor was installed below a natural spring in the War Branch watershed. The USGS had previously measured elevated nitrate concentrations from this spring. 

13 people stand next to the outlet of a bioreactor, which is a rock wall with a white pipe emerging, discharging water.
A Visit to the War Branch Bioreactor

Community partners tour the bioreactor at War Branch. 

The War Branch bioreactor was installed below a natural spring in the War Branch watershed. The USGS had previously measured elevated nitrate concentrations from this spring. 

Community partners tour the bioreactor at War Branch. 

The War Branch bioreactor was installed below a natural spring in the War Branch watershed. The USGS had previously measured elevated nitrate concentrations from this spring. 

Community members gather at an outreach table, reading USGS fact sheets
Outreach Event at War Branch

The USGS and local partners hosted a meeting at the War Branch monitoring station to share water-quality and conservation work happening in the watershed with farmers, environmental and agricultural agencies, nonprofit groups, and local universities.

The USGS and local partners hosted a meeting at the War Branch monitoring station to share water-quality and conservation work happening in the watershed with farmers, environmental and agricultural agencies, nonprofit groups, and local universities.

Color photograph of scientist conducting maintenance on volcanic gas monitoring station
August 2, 2024—Sulfur Cone gas monitoring maintenance

A Hawaiian Volcano Observatory gas scientist works to install a newly calibrated Multi-Gas instrument at the Sulfur Cone site. At an elevation of 3,430 meters (11,240 feet) above sea level, the air is rare! Working conditions are far more strenuous for HVO field teams at these high elevations due to the much lower levels of oxygen in the air to breathe.

A Hawaiian Volcano Observatory gas scientist works to install a newly calibrated Multi-Gas instrument at the Sulfur Cone site. At an elevation of 3,430 meters (11,240 feet) above sea level, the air is rare! Working conditions are far more strenuous for HVO field teams at these high elevations due to the much lower levels of oxygen in the air to breathe.

A map of the Sams Creek Watershed
Sams Creek Watershed

Sams Creek is an 11 square mile watershed which sits in both Frederick and Carrol counties in Maryland.   This watershed as a mixture of cattle and cropping practices.  

The purple dot on the map represents the location of the future Sams Creek monitoring site.

Sams Creek is an 11 square mile watershed which sits in both Frederick and Carrol counties in Maryland.   This watershed as a mixture of cattle and cropping practices.  

The purple dot on the map represents the location of the future Sams Creek monitoring site.

A map of the war branch watershed
War Branch Watershed

War Branch is an 11 square mile watershed in Rockingham County, Virginia with mostly poultry and beef agricultural activities. 

War Branch is an 11 square mile watershed in Rockingham County, Virginia with mostly poultry and beef agricultural activities. 

A map of the Bucks Branch watershed
Bucks Branch Watershed

Bucks Branch is a 7 square mile watershed in Sussex County, Delaware with mostly poultry and row-crop agricultural activities. 

The green dot on the map represents the location of the Bucks Branch monitoring site. Stream monitoring data from this iste can be viewed here.

Bucks Branch is a 7 square mile watershed in Sussex County, Delaware with mostly poultry and row-crop agricultural activities. 

The green dot on the map represents the location of the Bucks Branch monitoring site. Stream monitoring data from this iste can be viewed here.

A map of the Hammer Creek Watershed
Hammer Creek Watershed

Hammer Creek is a 13 square mile watershed in Lebanon County, Pennsylvania. It has a mixture of cropland and animal-raising activities. 

Hammer Creek is a 13 square mile watershed in Lebanon County, Pennsylvania. It has a mixture of cropland and animal-raising activities. 

A map of the Little Conewago watershed
Little Conewago Watershed

Little Conewago Creek is a 5 square mile watershed in Lebanon County, Pennsylvania. Like Hammer Creek, it has a mixture of animal and crop agricultural activities. 

Little Conewago Creek is a 5 square mile watershed in Lebanon County, Pennsylvania. Like Hammer Creek, it has a mixture of animal and crop agricultural activities. 

Color photograph of gound cracks on ash covered surface
June 6, 2024 — Cracks formed around recent Kīlauea Southwest Rift Zone eruption fissures

During an overflight at approximately 8:15 a.m. HST on June 6, 2024, USGS Hawaiian Volcano Observatory scientists observed the extensive crack features on either side of the now inactive fissures from the June 3 Kīlauea Southwest Rift Zone eruption. Cracks range in length and are parallel to the fissure system. USGS photo by A.R. Nalesnik. 

During an overflight at approximately 8:15 a.m. HST on June 6, 2024, USGS Hawaiian Volcano Observatory scientists observed the extensive crack features on either side of the now inactive fissures from the June 3 Kīlauea Southwest Rift Zone eruption. Cracks range in length and are parallel to the fissure system. USGS photo by A.R. Nalesnik. 

Interactive UAS Science Exhibit on display in Reston

Interactive UAS Science Exhibit on display in Reston

Included in this display are some of the earliest UAS platforms operated by the USGS and an interactive touch screen table that provides access to additional information and videos.

Interactive UAS Science Exhibit on display in Reston

Included in this display are some of the earliest UAS platforms operated by the USGS and an interactive touch screen table that provides access to additional information and videos.

Close up of water flowing over a rocky stream bed
War Branch, Shenandoah Valley Rural Stream

War Branch is a tributary of Smith Creek in the Shenandoah Valley. This location is a part of the Small Agricultural Watersheds monitoring project.

War Branch is a tributary of Smith Creek in the Shenandoah Valley. This location is a part of the Small Agricultural Watersheds monitoring project.

Was this page helpful?