
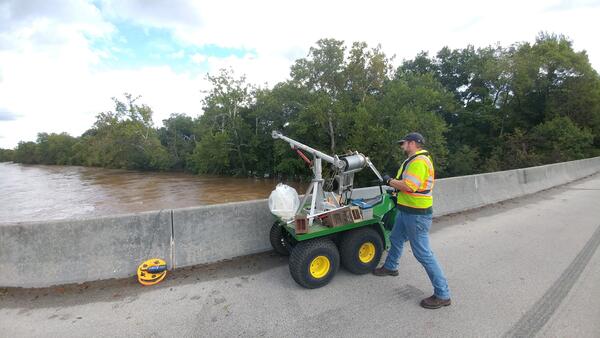
A USGS hydrotech conducts horizontally-integrated synoptic water quality sampling at Accotink Creek Near Annandale, VA.
Images
Images from USGS Chesapeake Bay reports and field activities are available to visualize and help translate the science. They are available for your use, just please cite the USGS as the source of respective images.
Filter Total Items: 149

Water Quality Sampling at Accotink Creek
A USGS hydrotech conducts horizontally-integrated synoptic water quality sampling at Accotink Creek Near Annandale, VA.

Measuring water quality parameters at Accotink Creek
Measuring water quality parameters at Accotink CreekA USGS hydrotech uses a water quality sonde to measure conditions at Accotink Creek Near Annandale, VA. This monitoring station is part of the USGS nontidal network.
Measuring water quality parameters at Accotink Creek
Measuring water quality parameters at Accotink CreekA USGS hydrotech uses a water quality sonde to measure conditions at Accotink Creek Near Annandale, VA. This monitoring station is part of the USGS nontidal network.

Collecting water samples from the James River
A USGS hydrologist conducts horizontally-integrated synoptic water sampling of the James River at Cartersville as part of the USGS's nontidal network monitoring efforts.
A USGS hydrologist conducts horizontally-integrated synoptic water sampling of the James River at Cartersville as part of the USGS's nontidal network monitoring efforts.

Aerial imagery from Anne Arundel County, Maryland
The animation in the figure shows aerial imagery from Anne Arundel County, Maryland, collected by National Agricultural Imagery Program (NAIP), followed by 1-meter Chesapeake Bay Land Cover (13 classes) and Land Use/Land Cover (54 classes) data products.
The animation in the figure shows aerial imagery from Anne Arundel County, Maryland, collected by National Agricultural Imagery Program (NAIP), followed by 1-meter Chesapeake Bay Land Cover (13 classes) and Land Use/Land Cover (54 classes) data products.

factSheetAustinCover.jpg
Abstract:

Updated short-term nitrogen and phosphorous trends in the Chesapeake Bay
Updated short-term nitrogen and phosphorous trends in the Chesapeake BayAn illustration of updated short-term nitrogen and phosphorous trends in the Chesapeake Bay
Updated short-term nitrogen and phosphorous trends in the Chesapeake Bay
Updated short-term nitrogen and phosphorous trends in the Chesapeake BayAn illustration of updated short-term nitrogen and phosphorous trends in the Chesapeake Bay

Trends in nitrogen, phosphorus, and suspended-sediment loads for RIM (2021)
Trends in nitrogen, phosphorus, and suspended-sediment loads for RIM (2021)Summary of long-term (1985-2021) and short-term (2012-2021) trends in nitrogen, phosphorus, and suspended-sediment loads for the River Input Monitoring stations. “Improving” or “Degrading” trends are classified as likelihood estimates greater than or equal to 67 percent, whereas “No trend” estimates are greater than 33 and less than 67 percent.
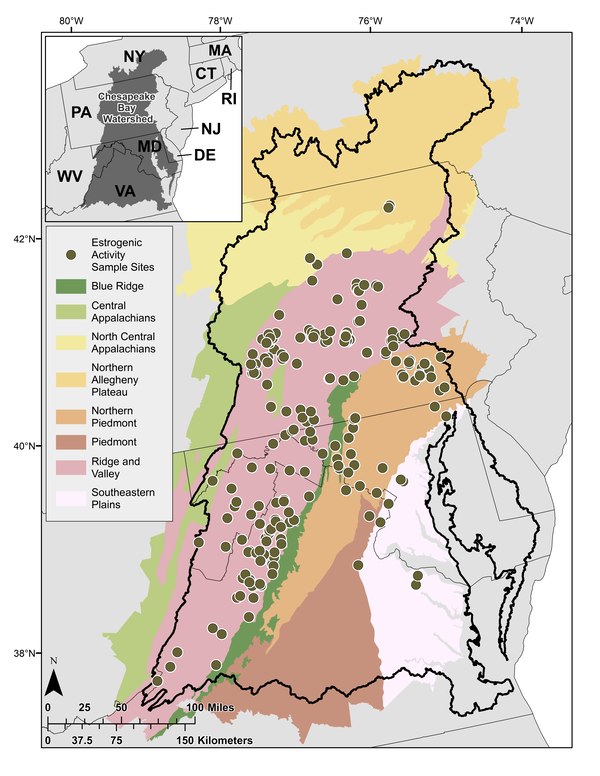
Map of surface water sampling locations in the Chesapeake Bay Watershed
Map of surface water sampling locations in the Chesapeake Bay WatershedSurface water sampling locations (n = 244) in the Chesapeake Bay Watershed shown with EPA Level 3 Ecoregions.
Map of surface water sampling locations in the Chesapeake Bay Watershed
Map of surface water sampling locations in the Chesapeake Bay WatershedSurface water sampling locations (n = 244) in the Chesapeake Bay Watershed shown with EPA Level 3 Ecoregions.

Impairments in creeks caused by altered geomorphology and high nutrients from sedimentation and agricultural runoff
Impairments in creeks caused by altered geomorphology and high nutrients from sedimentation and agricultural runoffImpairments in Linganore Creek in Maryland (top) and Little Conestoga Creek in Pennsylvania (bottom) caused by altered geomorphology and high nutrients from sedimentation and agricultural runoff.

Lewes Survey
Jacob Mavrogeorge surveys in Lewers, Delaware.
Photo credit: Neel Hodgkinson/USGS Contractor
Jacob Mavrogeorge surveys in Lewers, Delaware.
Photo credit: Neel Hodgkinson/USGS Contractor

Collecting water quality samples from the New River Gorge
Collecting water quality samples from the New River GorgeCollecting water quality samples from the New River Gorge in support of USGS-NPS partnership.
Fall 2022 Photo Contest Winner: Matt Kearns, USGS at Work category
Collecting water quality samples from the New River Gorge
Collecting water quality samples from the New River GorgeCollecting water quality samples from the New River Gorge in support of USGS-NPS partnership.
Fall 2022 Photo Contest Winner: Matt Kearns, USGS at Work category

Side-by-side panels to show land use/land cover (LULC) change in Charles County, MD from 2014-2018
Side-by-side panels to show land use/land cover (LULC) change in Charles County, MD from 2014-2018New development (red, black, yellow) near the towns of Waldorf and La Plata in Charles County, Maryland from 2014-2018.

Side-by-side panels to show forest harvested for timber in southwest Cumberland County, Virginia from 2014-2018
Side-by-side panels to show forest harvested for timber in southwest Cumberland County, Virginia from 2014-2018Forest harvested for timber (brown) in southwest Cumberland County, Virginia from 2014-2018.

Side-by-side panels to show forest harvested for timber for the development of solar fields in southwest Cumberland County, Virginia from 2014-2018
Side-by-side panels to show forest harvested for timber for the development of solar fields in southwest Cumberland County, Virginia from 2014-2018Forests in this area of Louisa County, Virginia were recently cleared for timber (brown) and for the development of solar fields (yellow).

Differential leveling techniques are performed to determine reference-mark elevations at historic streamgage
Differential leveling techniques are performed to determine reference-mark elevations at historic streamgageDifferential leveling techniques are performed by Alex Wong to determine reference-mark elevations at historic USGS streamgage, 01303000 Mill Neck Creek in Mill Neck, NY.
Summer 2022 Photo Contest Winner: Amy Simonson, Where We Work category
Capturing an elevated stage (storm-impacted) water quality sample
Capturing an elevated stage (storm-impacted) water quality sampleUSGS scientist Doug Moyer capturing an elevated stage (storm-impacted) water quality sample at the South Fork Shenandoah River near Lynnwood, VA.
Data for this monitoring site can be found at USGS Water Data for the Nation.

Downstream side of the Conowingo Dam on the Susquehanna River
Downstream side of the Conowingo Dam on the Susquehanna RiverDownstream side of the Conowingo (hydroelectric) Dam on the Susquehanna River in Conowingo, Maryland.
Summer 2022 Photo Contest: Nicholas Giro, Honorable Mention category
Downstream side of the Conowingo Dam on the Susquehanna River
Downstream side of the Conowingo Dam on the Susquehanna RiverDownstream side of the Conowingo (hydroelectric) Dam on the Susquehanna River in Conowingo, Maryland.
Summer 2022 Photo Contest: Nicholas Giro, Honorable Mention category

Matt Burgess pilots a drone over research ponds
Matt Burgess from the USGS National Uncrewed Systems Office pilots a drone over research ponds at the Eastern Ecological Science Center as part of a methods development campaign to examine how multiple types of remote sensors may be used to map and identify algae, including those that lead to Harmful Algal Blooms.
Matt Burgess from the USGS National Uncrewed Systems Office pilots a drone over research ponds at the Eastern Ecological Science Center as part of a methods development campaign to examine how multiple types of remote sensors may be used to map and identify algae, including those that lead to Harmful Algal Blooms.

Chart of changes in smallmouth bass
Annual and seasonal changes in plasma vitellogenin (Vtg) and hepatic vitellogenin (vtg) gene transcripts in A) female and B) male smallmouth bass. C) Prevalence and severity of testicular oocytes (TO) in male smallmouth bass.
Annual and seasonal changes in plasma vitellogenin (Vtg) and hepatic vitellogenin (vtg) gene transcripts in A) female and B) male smallmouth bass. C) Prevalence and severity of testicular oocytes (TO) in male smallmouth bass.

Chart of concentrations of three of the most detected pesticides in Dargan, MD
Chart of concentrations of three of the most detected pesticides in Dargan, MDConcentrations of three of the most detected pesticides (simazine, atrazine, and metolachlor) sampled near the confluence of Antietam Creek and the Potomac River in Dargan, Maryland, 2013-2019. Dots represent smallmouth bass sampling dates.

Chesapeake Bay Land Use Map and Chart
Land use (2016) in the immediate (insert) and upstream catchments around the smallmouth bass, Antietam Creek – Potomac Mainstem collection site near Dargan, Maryland.
Land use (2016) in the immediate (insert) and upstream catchments around the smallmouth bass, Antietam Creek – Potomac Mainstem collection site near Dargan, Maryland.