An official website of the United States government
Here's how you know
Official websites use .gov
A .gov website belongs to an official government organization in the United States.
Secure .gov websites use HTTPS
A lock () or https:// means you’ve safely connected to the .gov website. Share sensitive information only on official, secure websites.
For more than 50 years, Landsathas imaged Earth’s land and near-shore surfaces as the satellites descend in midmorning orbit, when daily sunlight is optimal. That’s just what they’ve always done.
Currently, Landsat 8 and Landsat 9 circle the globe while also making better use of their ascending paths, peering into the darkness for special requests.
The visible spectral bands of Landsat—the same blue, green and red wavelength colors our eyes can see—are typically not that useful when collected on the ascending orbit node (also known as “nighttime imagery”). The exception is twilight or darkness at Earth’s poles, which can provide a surprisingly clear observation in the thermal infrared spectral bands where snow, ice and water temperatures can be retrieved when the sun is at or below the horizon.
Through the dark, shortwave infrared (SWIR) bands within Landsat’s Operational Land Imager (OLI) instrument can detect intense heat sources such as volcanoes or active fires, while the Thermal Infrared Sensor (TIRS) measures surface temperatures that range from geothermal geysers to solid ice.
There is a growing interest in seeing what Landsat can capture as it ascends over the dark side of Earth, according to Dr. Christopher Crawford, the Landsat Project Scientist at the U.S. Geological Survey (USGS) Earth Resources Observation and Science (EROS) Center. Crawford leads and oversees Landsat’s long-term Earth data acquisition strategy for the USGS.
“I’ve seen a noticeable uptick in the number of nighttime imaging special requests. That’s a very active and innovative measurement science area for Landsat right now,” Crawford said.
“We have active volcanoes, we’ve got an ice environment that’s changing, and wildfire occurrences are increasingly growing into hazards that threaten human safety, infrastructure and wildlife, among other issues. Nighttime imaging is an all-purpose solution, kind of like Jiffy Baking Mix.”
Background: East Antarctica’s Brunt Ice Shelf (large purplish area) is shown in this Landsat 8 thermal image along with Iceberg A-74 (small blue area in top left) on April 4, 2021, a little over a month after the iceberg broke off from the northern side of the ice shelf. Sea ice (pale blue) separates them in the image, which shows the structural details of the sea ice, ice shelf and ice sheet topography.
A particular request for nighttime imagery that turned into a “systematic observation,” Crawford said, is Yellowstone National Park. The volcanic area’s 10,000 thermal features, such as geysers or hot springs or steam vents, can get hotter or colder, and they can appear or disappear.
Crawford is fascinated by volcanoes in general and recognizes the value of imaging them day and night. After Landsat 9 launched in 2021, when two satellites with the same high-quality sensors would together yield an image of each area of land every eight days, it seemed like a good time to start a consistent annual campaign to capture active volcanoes at night, he said.
R. Greg Vaughan of the USGS Astrogeology Science Center does field work at Yellowstone National Park. USGS photo
R. Greg Vaughan of the USGS Astrogeology Science Center, who researches active volcanoes, gave him a list. Vaughan has used Landsat data and other remote sensing methods to monitor changing thermal features in his role as the remote sensing lead for the Yellowstone Volcano Observatory.
Vaughan also taught Crawford something about imaging Yellowstone’s thermal features at night—that the best season for locating them is during winter. That’s when the contrast between the heated features and the colder surrounding area is greatest.
“The thing that I’ve probably taken away the most is that you have to acquire data to then understand what data to continue to acquire,” Crawford said.
Watch a video about imagery related to the discovery of a new thermal area in Yellowstone.
Vaughan spotted an exciting surprise when reviewing Landsat 8 nighttime TIRS data of Yellowstone acquired in April 2017. Comparing warm areas in the imagery to previously mapped thermal features, he found a “big blob of bright, warm pixels” that didn’t match anything on the map.
After ruling out the possibility that it could be a thawing lake next to frozen land, he looked at the secluded area with daytime aerial imagery. The telltale signs of a new and growing thermal feature were there: bright hydrothermal-altered soil and dead and dying trees.
“This is why I love Landsat 8 and 9 so much. These instruments acquire data regularly, not just during the day, but they can also be tasked to acquire data at night on a regular basis. And this is really critical for my work,” Vaughan said.
Vaughan has been named a member of the current Landsat Science Team, a group of scientific and technical subject matter experts who provide analysis and advice to the Landsat Program. His research in that capacity will focus on active volcanoes.
Landsat-8 nighttime thermal infrared image, Tern Lake, Yellowstone
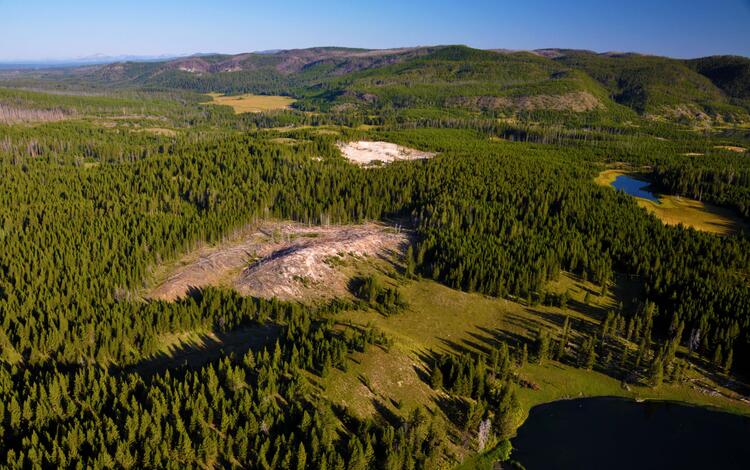
Aerial view of the new thermal area, in the center left. The existing Tern Lake
Above left: A Landsat 8 nighttime thermal infrared image from April 2017 shows the Tern Lake area in Yellowstone National Park. In Yellowstone, temperatures are extremely cold at night in the winter, and most lakes are frozen (dark pixels). West Tern Lake seems to be thawing here; it might receive some thermal water inflow from nearby hot springs. The patch of bright (warm) pixels between West Tern Lake and the Tern Lake Thermal Area emerged over a period of roughly 20 years. Lakes are outlined in blue; known thermal areas are outlined in red; and the red triangles are individual thermal features that have been mapped. Image credit: R. Greg Vaughn, USGS
Above right: An aerial view of the area in the Landsat 8 nighttime image shows the new thermal area (center left) that R. Greg Vaughan spotted in the Landsat image. The existing Tern Lake Thermal Area is the bright white patch of ground in the upper middle part of the image. West Tern Lake is the dark area in the lower right, and Tern Lake is above that. Photo credit: Michael Poland, USGS
Fires, Flares and Urban Areas Among Requests
The fire community in the western United States also finds value in Landsat nighttime imagery, Crawford said—including the energy industry and its infrastructure.
The Department of Energy’s Pacific Northwest National Laboratory submits annual special requests for proactive nighttime imaging of seasonal wildfires to support on-the-ground decision making.
“We’ve done it three seasons in a row, and the results are pretty remarkable in terms of what we’re able to see,” especially with the SWIR bands, Crawford said. Those results compare well to airborne infrared sensing taken from low-altitude flights over the same wildfires.
Landsat can also detect gas flares that are useful to oil and gas industry functions. “There are regular special requests submitted to monitor global sites that produce Liquefied Natural Gas, or LNG,” Crawford said.
In addition, he sees requests for nighttime images over particular cities to map urban temperature, which may be higher than cooler surrounding areas.
One recent request went beyond the already routine monitoring of active volcanoes in Iceland to encompass the entire country and coastline in a large seasonal campaign to survey overall volcanic activity.
Crawford weighs this type of request carefully, posing these questions: “Does this advance the science mission? Is it serving the user community?”
For Iceland, that was a yes.
“I look for areas where Landsat imaging data may be underutilized, as well as areas for strategic science mission advancement and societal benefits, and in many ways, these growth areas can be enabled through the data acquisition process,” Crawford said.
Landsat Image of California Caldor Fire - August 29, 2021
Landsat Extended Acquisitions of the Poles (LEAP) Imaging of Petermann Glacier
Above left: Landsat 8’s thermal infrared, shortwave infrared and near infrared spectral bands expose the Caldor Fire’s advancing edge south of Lake Tahoe in California in a nighttime image from August 29, 2021.
Above right: This twilight thermal infrared image of Petermann Glacier, Greenland, was captured by Landsat 9 on January 5, 2024. This winter image displays data acquired when the sun was below the horizon. Darker areas are relatively colder than bright areas.
A LEAP Forward
A significant advancement in learning about Landsat’s nighttime capabilities came with the effort to monitor polar regions year-round, with leadership from former Landsat Science Team member Dr. Ted Scambos from the University of Colorado Boulder.
The Landsat Extended Acquisition of the Poles (LEAP) campaign now routinely collects imagery over the polar regions, where few wintertime images had existed in Landsat’s data record before. The visible-to-shortwave infrared and thermal infrared spectral bands allow scientists to track changes in polar ice sheets, measure polar surface temperatures and examine the interaction of ocean water and ice shelves.
Click the image to hear Chris Crawford talk about the Landsat Extended Acquisition of the Poles (LEAP) campaign on an Eyes on Earth podcast episode.
The sun’s low angle is not much of a hindrance to imaging data quality, Crawford said in an Eyes on Earth episode about the LEAP campaign. “Snow and ice are still really bright mediums on the surface, and so even if the illumination is low, you can still see a lot of detail because of the high reflectivity.”
Fortunately, nighttime imaging does not burden Landsat 8 and Landsat 9. “The instruments are always on, so it’s just a matter of whether we’re recording the data,” Crawford said.
The imagery’s darkness helps keep data volumes much lower than the daytime and allows sufficient time for the satellites to pass off the data to ground stations around the globe whose function is to downlink the recorded data.
“We’re starting to leverage Landsat 8 and Landsat 9 observatory capabilities to maximum scientific and societal benefit returns,” Crawford said.
“We’re populating the Landsat archive with long-term image data records that are helpful for not only quantifying changes on the Earth’s surface right now, but in the past and in the future.”
All imagery collected by special requests is made available to the public through the USGS EarthExplorer website. Select the “Landsat Collection 2 Level-1” dataset, and then select “Night” under Additional Criteria.
Background: A nighttime Landsat 8 image of the Philippines’ Taal Volcano, using the two shortwave infrared spectral bands and a near infrared band, is overlaid on a daytime Landsat panchromatic black and white image. The nighttime image was acquired on January 15, 2020, a few days after the volcano erupted. The heat signature from volcanic activity shows up as bright orange/red. The daytime image was acquired before the eruption on December 6, 2019.
Yellowstone was established as the world’s first national park primarily because of its extraordinary geysers, hot springs, mudpots and steam vents, as well as other geologic features. YVO scientists monitor these hydrothermal features as part of an effort to research and preserve them.
Hydrothermal Monitoring in Yellowstone National Park
Yellowstone was established as the world’s first national park primarily because of its extraordinary geysers, hot springs, mudpots and steam vents, as well as other geologic features. YVO scientists monitor these hydrothermal features as part of an effort to research and preserve them.
Landsat 8 and Landsat 9 Earth imaging acquisitions are guided by their respective Long Term Acquisition Plan (LTAP), that has been established for each satellite observatory. The LTAP is structured around the Worldwide Reference System-2 (WRS-2) grid, which partitions Landsat swath imaging of the Earth into ~185 × 180 km scenes using a path/row notation. These WRS-2 scenes represent the
The U.S. Geological Survey, in cooperation with the National Park Service, Yellowstone Center for Resources, as part of work for the Yellowstone Volcano Observatory, has compiled a shapefile map of thermal areas and thermal water bodies in Yellowstone National Park. A thermal area is a continuous, or nearly continuous, geologic unit that contains one or more thermal features (e.g., hot...
Landsat Extended Acquisitions of the Poles (LEAP) imaging plan is a Landsat special request data collection program for Earth's polar regions that include Antarctica, Greenland, and Arctic sea ice geographies. The LEAP program includes Landsat 8 and Landsat 9 observatories that operationally acquire spaceborne images of all Earth's land surface and near-shore coastal environments. These...
Eyes on Earth Episode 137 – Landsat Takes Yellowstone’s Temperature
The Yellowstone National Park area has more than 10,000 thermal features. And while Old Faithful is a pretty predictable geyser, some thermal features can change quite a bit. New ones can even pop up! Remote sensing provides a tool for monitoring them—especially the thermal infrared sensors (TIRS) on Landsat 8 and Landsat 9 satellites.
The Yellowstone National Park area has more than 10,000 thermal features. And while Old Faithful is a pretty predictable geyser, some thermal features can change quite a bit. New ones can even pop up! Remote sensing provides a tool for monitoring them—especially the thermal infrared sensors (TIRS) on Landsat 8 and Landsat 9 satellites.
Eyes on Earth Episode 116 – Landsat Images the Twilight Zone
Landsat has documented changes all over the world for over 50 years. Changes in polar regions are happening especially rapidly. But it’s dark in polar regions much of the time. Therefore, a new acquisition scheme is adding more imagery of these dark, polar regions so these changes can be studied in more detail, even in polar twilight.
Landsat has documented changes all over the world for over 50 years. Changes in polar regions are happening especially rapidly. But it’s dark in polar regions much of the time. Therefore, a new acquisition scheme is adding more imagery of these dark, polar regions so these changes can be studied in more detail, even in polar twilight.
Landsat 8 nighttime thermal infrared image of Yellowstone National Park from January 31, 2023
Landsat 8 nighttime thermal infrared image of Yellowstone National Park from January 31, 2023. Satellite-based thermal infrared data show areas on the surface that are warmer versus cooler, and they can be used to estimate surface temperature and the geothermal radiative heat output from the Yellowstone magmatic and hydrothermal system.
Landsat 8 nighttime thermal infrared image of Yellowstone National Park from January 31, 2023. Satellite-based thermal infrared data show areas on the surface that are warmer versus cooler, and they can be used to estimate surface temperature and the geothermal radiative heat output from the Yellowstone magmatic and hydrothermal system.
Landsat 8 nighttime thermal infrared image of Yellowstone from 28 January 2022
Landsat 8 nighttime thermal infrared image of Yellowstone from 28 January 2022. Inset images are zoomed in on the area outlined by the white square. Inset image (A) has the raw data values, which range from 9070 to 21284. Inset image (B) shows the same image converted to spectral radiance, where values range from 3.13 to 7.21 W/m2/micron
Landsat 8 nighttime thermal infrared image of Yellowstone from 28 January 2022. Inset images are zoomed in on the area outlined by the white square. Inset image (A) has the raw data values, which range from 9070 to 21284. Inset image (B) shows the same image converted to spectral radiance, where values range from 3.13 to 7.21 W/m2/micron
Landsat Image of California Caldor Fire - August 29, 2021
Landsat's thermal and infrared bands also expose the Caldor fire's advancing edge at night time. This image is from August 29, 201, 15 days after ignition.
Landsat's thermal and infrared bands also expose the Caldor fire's advancing edge at night time. This image is from August 29, 201, 15 days after ignition.
Landsat 8 thermal image of Brunt Ice Shelf and Iceberg A-74
East Antarctica's Brunt Ice Shelf (large purplish area) is shown in this Landsat 8 thermal image along with Iceberg A-74 (top left purple area) on April 4, 2021, a little over a month after the iceberg broke off from the northern side of the ice shelf.
East Antarctica's Brunt Ice Shelf (large purplish area) is shown in this Landsat 8 thermal image along with Iceberg A-74 (top left purple area) on April 4, 2021, a little over a month after the iceberg broke off from the northern side of the ice shelf.
This image shows a false color (bands 7,6,5) nighttime Landsat 8 image of the Taal Volcano overlaid on a daytime Landsat panchromatic black and white image (band 8). The nighttime image from path 220/row194 was acquired on January 15, 2020, a few days after the volcano's eruption.
This image shows a false color (bands 7,6,5) nighttime Landsat 8 image of the Taal Volcano overlaid on a daytime Landsat panchromatic black and white image (band 8). The nighttime image from path 220/row194 was acquired on January 15, 2020, a few days after the volcano's eruption.
Aerial view of the new thermal area, in the center left. The existing Tern Lake
Aerial view of the new thermal area, in the center left. The existing Tern Lake thermal area is the bright white patch of ground in the upper middle part of the image. West Tern Lake is in the lower right. Research conducted under NPS Geology Programs Milestones Permit 2016-9.
Aerial view of the new thermal area, in the center left. The existing Tern Lake thermal area is the bright white patch of ground in the upper middle part of the image. West Tern Lake is in the lower right. Research conducted under NPS Geology Programs Milestones Permit 2016-9.
Scientists with the USGS Yellowstone Volcano Observatory use satellite and aerial imagery to map hot springs, geothermal vents, and geysers at Yellowstone National Park. They recently found an entirely new thermal area miles from the nearest trailhead. Landsat 8's thermal infrared sensors captured the change in a nighttime image from April of 2017.
Scientists with the USGS Yellowstone Volcano Observatory use satellite and aerial imagery to map hot springs, geothermal vents, and geysers at Yellowstone National Park. They recently found an entirely new thermal area miles from the nearest trailhead. Landsat 8's thermal infrared sensors captured the change in a nighttime image from April of 2017.
Landsat-8 nighttime thermal infrared image, Tern Lake, Yellowstone
Landsat-8 nighttime thermal infrared image from April 2017 showing the Tern Lake area. In Yellowstone, temperatures are extremely cold at night in the winter, and most lakes are frozen (dark pixels). West Tern Lake seems to be thawing here - perhaps it receives some thermal waters from nearby hot springs.
Landsat-8 nighttime thermal infrared image from April 2017 showing the Tern Lake area. In Yellowstone, temperatures are extremely cold at night in the winter, and most lakes are frozen (dark pixels). West Tern Lake seems to be thawing here - perhaps it receives some thermal waters from nearby hot springs.
The Landsat Acquisition Tool helps determine when the Landsat satellites acquire data over specific areas of interest, displaying the paths that were acquired on any given day.
Landsat Images the Twilight Zone—New Eyes on Earth Episode
A new Eyes on Earth podcast discusses a special acquisition campaign called the Landsat Extended Acquisition of the Poles (LEAP). We spoke with Chris...
The Landsat 8 and Landsat 9 satellites together acquire approximately 1,500 scenes daily. These scenes are available for download within 6 hours of acquisition. Landsat satellite acquisitions are managed as a system, known as a satellite constellation. Long-Term Acquisition Plans (LTAPs) direct and optimize the daily acquisitions of each active Landsat satellite. Special requests for future...
Can Landsat satellite acquisition requests be made for a specific date and location?
The Landsat 8 and Landsat 9 satellites together acquire approximately 1,500 scenes daily. These scenes are available for download within 6 hours of acquisition. Landsat satellite acquisitions are managed as a system, known as a satellite constellation. Long-Term Acquisition Plans (LTAPs) direct and optimize the daily acquisitions of each active Landsat satellite. Special requests for future...
Ascending (nighttime) WRS-2 path/row numbers are different from descending (daytime) path/rows. Cloud cover values for Landsat night scenes will always be -1. If you know the daytime path/row or coordinates and want to know the nighttime path/row, use the WRS-2 Path/Row to Latitude/Longitude Converter. Use EarthExplorer to search using path/row or coordinates: Access EarthExplorer. On the Search...
How do I search for and download ascending (nighttime) Landsat scenes?
Ascending (nighttime) WRS-2 path/row numbers are different from descending (daytime) path/rows. Cloud cover values for Landsat night scenes will always be -1. If you know the daytime path/row or coordinates and want to know the nighttime path/row, use the WRS-2 Path/Row to Latitude/Longitude Converter. Use EarthExplorer to search using path/row or coordinates: Access EarthExplorer. On the Search...
Yellowstone was established as the world’s first national park primarily because of its extraordinary geysers, hot springs, mudpots and steam vents, as well as other geologic features. YVO scientists monitor these hydrothermal features as part of an effort to research and preserve them.
Hydrothermal Monitoring in Yellowstone National Park
Yellowstone was established as the world’s first national park primarily because of its extraordinary geysers, hot springs, mudpots and steam vents, as well as other geologic features. YVO scientists monitor these hydrothermal features as part of an effort to research and preserve them.
Landsat 8 and Landsat 9 Earth imaging acquisitions are guided by their respective Long Term Acquisition Plan (LTAP), that has been established for each satellite observatory. The LTAP is structured around the Worldwide Reference System-2 (WRS-2) grid, which partitions Landsat swath imaging of the Earth into ~185 × 180 km scenes using a path/row notation. These WRS-2 scenes represent the
The U.S. Geological Survey, in cooperation with the National Park Service, Yellowstone Center for Resources, as part of work for the Yellowstone Volcano Observatory, has compiled a shapefile map of thermal areas and thermal water bodies in Yellowstone National Park. A thermal area is a continuous, or nearly continuous, geologic unit that contains one or more thermal features (e.g., hot...
Landsat Extended Acquisitions of the Poles (LEAP) imaging plan is a Landsat special request data collection program for Earth's polar regions that include Antarctica, Greenland, and Arctic sea ice geographies. The LEAP program includes Landsat 8 and Landsat 9 observatories that operationally acquire spaceborne images of all Earth's land surface and near-shore coastal environments. These...
Eyes on Earth Episode 137 – Landsat Takes Yellowstone’s Temperature
The Yellowstone National Park area has more than 10,000 thermal features. And while Old Faithful is a pretty predictable geyser, some thermal features can change quite a bit. New ones can even pop up! Remote sensing provides a tool for monitoring them—especially the thermal infrared sensors (TIRS) on Landsat 8 and Landsat 9 satellites.
The Yellowstone National Park area has more than 10,000 thermal features. And while Old Faithful is a pretty predictable geyser, some thermal features can change quite a bit. New ones can even pop up! Remote sensing provides a tool for monitoring them—especially the thermal infrared sensors (TIRS) on Landsat 8 and Landsat 9 satellites.
Eyes on Earth Episode 116 – Landsat Images the Twilight Zone
Landsat has documented changes all over the world for over 50 years. Changes in polar regions are happening especially rapidly. But it’s dark in polar regions much of the time. Therefore, a new acquisition scheme is adding more imagery of these dark, polar regions so these changes can be studied in more detail, even in polar twilight.
Landsat has documented changes all over the world for over 50 years. Changes in polar regions are happening especially rapidly. But it’s dark in polar regions much of the time. Therefore, a new acquisition scheme is adding more imagery of these dark, polar regions so these changes can be studied in more detail, even in polar twilight.
Landsat 8 nighttime thermal infrared image of Yellowstone National Park from January 31, 2023
Landsat 8 nighttime thermal infrared image of Yellowstone National Park from January 31, 2023. Satellite-based thermal infrared data show areas on the surface that are warmer versus cooler, and they can be used to estimate surface temperature and the geothermal radiative heat output from the Yellowstone magmatic and hydrothermal system.
Landsat 8 nighttime thermal infrared image of Yellowstone National Park from January 31, 2023. Satellite-based thermal infrared data show areas on the surface that are warmer versus cooler, and they can be used to estimate surface temperature and the geothermal radiative heat output from the Yellowstone magmatic and hydrothermal system.
Landsat 8 nighttime thermal infrared image of Yellowstone from 28 January 2022
Landsat 8 nighttime thermal infrared image of Yellowstone from 28 January 2022. Inset images are zoomed in on the area outlined by the white square. Inset image (A) has the raw data values, which range from 9070 to 21284. Inset image (B) shows the same image converted to spectral radiance, where values range from 3.13 to 7.21 W/m2/micron
Landsat 8 nighttime thermal infrared image of Yellowstone from 28 January 2022. Inset images are zoomed in on the area outlined by the white square. Inset image (A) has the raw data values, which range from 9070 to 21284. Inset image (B) shows the same image converted to spectral radiance, where values range from 3.13 to 7.21 W/m2/micron
Landsat Image of California Caldor Fire - August 29, 2021
Landsat's thermal and infrared bands also expose the Caldor fire's advancing edge at night time. This image is from August 29, 201, 15 days after ignition.
Landsat's thermal and infrared bands also expose the Caldor fire's advancing edge at night time. This image is from August 29, 201, 15 days after ignition.
Landsat 8 thermal image of Brunt Ice Shelf and Iceberg A-74
East Antarctica's Brunt Ice Shelf (large purplish area) is shown in this Landsat 8 thermal image along with Iceberg A-74 (top left purple area) on April 4, 2021, a little over a month after the iceberg broke off from the northern side of the ice shelf.
East Antarctica's Brunt Ice Shelf (large purplish area) is shown in this Landsat 8 thermal image along with Iceberg A-74 (top left purple area) on April 4, 2021, a little over a month after the iceberg broke off from the northern side of the ice shelf.
This image shows a false color (bands 7,6,5) nighttime Landsat 8 image of the Taal Volcano overlaid on a daytime Landsat panchromatic black and white image (band 8). The nighttime image from path 220/row194 was acquired on January 15, 2020, a few days after the volcano's eruption.
This image shows a false color (bands 7,6,5) nighttime Landsat 8 image of the Taal Volcano overlaid on a daytime Landsat panchromatic black and white image (band 8). The nighttime image from path 220/row194 was acquired on January 15, 2020, a few days after the volcano's eruption.
Aerial view of the new thermal area, in the center left. The existing Tern Lake
Aerial view of the new thermal area, in the center left. The existing Tern Lake thermal area is the bright white patch of ground in the upper middle part of the image. West Tern Lake is in the lower right. Research conducted under NPS Geology Programs Milestones Permit 2016-9.
Aerial view of the new thermal area, in the center left. The existing Tern Lake thermal area is the bright white patch of ground in the upper middle part of the image. West Tern Lake is in the lower right. Research conducted under NPS Geology Programs Milestones Permit 2016-9.
Scientists with the USGS Yellowstone Volcano Observatory use satellite and aerial imagery to map hot springs, geothermal vents, and geysers at Yellowstone National Park. They recently found an entirely new thermal area miles from the nearest trailhead. Landsat 8's thermal infrared sensors captured the change in a nighttime image from April of 2017.
Scientists with the USGS Yellowstone Volcano Observatory use satellite and aerial imagery to map hot springs, geothermal vents, and geysers at Yellowstone National Park. They recently found an entirely new thermal area miles from the nearest trailhead. Landsat 8's thermal infrared sensors captured the change in a nighttime image from April of 2017.
Landsat-8 nighttime thermal infrared image, Tern Lake, Yellowstone
Landsat-8 nighttime thermal infrared image from April 2017 showing the Tern Lake area. In Yellowstone, temperatures are extremely cold at night in the winter, and most lakes are frozen (dark pixels). West Tern Lake seems to be thawing here - perhaps it receives some thermal waters from nearby hot springs.
Landsat-8 nighttime thermal infrared image from April 2017 showing the Tern Lake area. In Yellowstone, temperatures are extremely cold at night in the winter, and most lakes are frozen (dark pixels). West Tern Lake seems to be thawing here - perhaps it receives some thermal waters from nearby hot springs.
The Landsat Acquisition Tool helps determine when the Landsat satellites acquire data over specific areas of interest, displaying the paths that were acquired on any given day.
Landsat Images the Twilight Zone—New Eyes on Earth Episode
A new Eyes on Earth podcast discusses a special acquisition campaign called the Landsat Extended Acquisition of the Poles (LEAP). We spoke with Chris...
The Landsat 8 and Landsat 9 satellites together acquire approximately 1,500 scenes daily. These scenes are available for download within 6 hours of acquisition. Landsat satellite acquisitions are managed as a system, known as a satellite constellation. Long-Term Acquisition Plans (LTAPs) direct and optimize the daily acquisitions of each active Landsat satellite. Special requests for future...
Can Landsat satellite acquisition requests be made for a specific date and location?
The Landsat 8 and Landsat 9 satellites together acquire approximately 1,500 scenes daily. These scenes are available for download within 6 hours of acquisition. Landsat satellite acquisitions are managed as a system, known as a satellite constellation. Long-Term Acquisition Plans (LTAPs) direct and optimize the daily acquisitions of each active Landsat satellite. Special requests for future...
Ascending (nighttime) WRS-2 path/row numbers are different from descending (daytime) path/rows. Cloud cover values for Landsat night scenes will always be -1. If you know the daytime path/row or coordinates and want to know the nighttime path/row, use the WRS-2 Path/Row to Latitude/Longitude Converter. Use EarthExplorer to search using path/row or coordinates: Access EarthExplorer. On the Search...
How do I search for and download ascending (nighttime) Landsat scenes?
Ascending (nighttime) WRS-2 path/row numbers are different from descending (daytime) path/rows. Cloud cover values for Landsat night scenes will always be -1. If you know the daytime path/row or coordinates and want to know the nighttime path/row, use the WRS-2 Path/Row to Latitude/Longitude Converter. Use EarthExplorer to search using path/row or coordinates: Access EarthExplorer. On the Search...