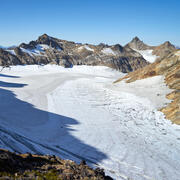
Beautiful geonarrative published about decades old USGS Benchmark Glacier Project
A new, beautiful geonarrative titled “The Glacier-Climate Connection” describes the USGS Benchmark Glacier Project— one of the longest running studies of glaciers on Earth. The USGS Benchmark Glacier Project aims to understand climate-glacier relationships and the recently published geonarrative uses a variety of visual approaches to educate the viewer about this long-standing research project.
A recently published geonarrative titled “The Glacier-Climate Connection” uses beautiful images, maps, infographics, and videos to tell the story of one of the longest running studies of glaciers on Earth—the USGS Benchmark Glacier Project (“Project” going forward). For over six decades the Project has coordinated intensive glacier field research to better understand the physics that control glacier dynamics, the connection between climate and glaciers, and downstream impacts of glacier loss.
Recording the gain and loss of ice, or mass balance, at the five Benchmark Glaciers has been a constant throughout the Project’s history. The diversity of sites, ranging from mid to high latitude and from maritime to continental climate, allows scientists to understand the influence of climate on glaciers across the continent and apply those data to mountain systems around the world
In addition to providing some historical background about the Project, the Glacier-Climate Connection geonarrative contains an interactive map showing the locations of Project glaciers and a stunning photo along with a short profile for each glacier. Other photos and videos of the glaciers educate the viewer about glacier characteristics (Do you know what “Seracs” are?), depict glacier fieldwork, demonstrate glacial retreat over time, and show the beauty of glacial landscapes (not to mention how difficult it is to get the data for this type of research).
The geonarrative provides the viewer an interesting and fun way to learn about long-term glacier records and evolving glaciological techniques that provide the foundation for new research that inform sea level and water resource management strategies in this time of rapid glacier loss and climate change. It is designed for broad audiences, including students and teachers, and includes “before and after” images of glaciers, maps, and infographics as well as pictures of scientists at work, providing an idea of what conducting research on glaciers might be like. Links to datasets for each glacier can be classroom resources – see if you can generate your own graphs and discover something new!
Oh, there’s also footage of ice worms……in the snow.


