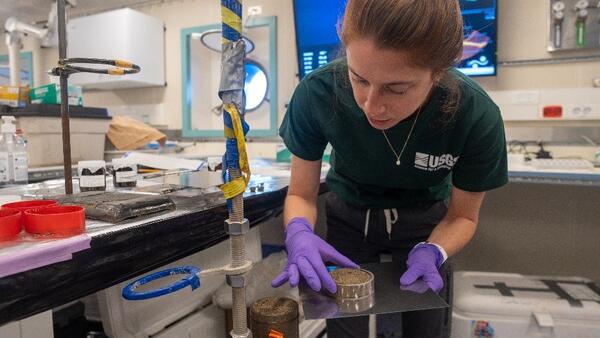
U.S. flag

An official website of the United States government

Images

Pacific Coastal and Marine Science Center images.

Filter Total Items: 1313
Animated GIF of Cascadia 1700 tsunami simulation at Salmon River, Oregon
Image of an oil drilling platform offshore of Huntington Beach, California, with the sun setting behind it
Oil drilling platform offshore of Huntington Beach, California

Image of an oil drilling platform offshore of Huntington Beach, California, with the sun setting behind it.

Recipients of the FBI Director's Award in Santa Barbara, California

On April 19, 2024, in Santa Barbara, California, Susan Zaleski, Donna Schroeder, Dr. Guy Cochrane, and Dr. Mark Page all received FBI Director’s Awards for their participation in the Huntington Beach oil spill case. From left to right, USERT lead Ty Summers, Special Agent Ketrin Adam, Assistant Agent in Charge Sean Haworth, Dr. Guy Cochrane, Donna Schroeder, Dr.

On April 19, 2024, in Santa Barbara, California, Susan Zaleski, Donna Schroeder, Dr. Guy Cochrane, and Dr. Mark Page all received FBI Director’s Awards for their participation in the Huntington Beach oil spill case. From left to right, USERT lead Ty Summers, Special Agent Ketrin Adam, Assistant Agent in Charge Sean Haworth, Dr. Guy Cochrane, Donna Schroeder, Dr.

Animated GIF showing corrected thermal imagery from Ofu
Animated GIF showing corrected thermal imagery from Ofu, American Samoa

Animated GIF showing corrected thermal imagery of a groundwater plume discharging onto a reef at Ofu, American Samoa. 

Map of Ofu, American Samoa, showing study sites
Diagram showing thermal camera method
Diagram showing thermal camera method on Ofu, American Samoa

Thermal camera tower method. 1) Original oblique view data 2) Orthorectified nadir view 3) thermal corrections for angular and distance dependence 4) Calibrated thermal image. 

Study area for Modeling Coastal Flooding Dynamics Along the U.S. Southeast Atlantic Coast

Study region with GTSM-ERA5 output locations marked as black circles and tide gauge locations marked as blue squares. Gray labels denote NOAA designated tide gauge station IDs. Information on tide gauges, including ID number, latitude, longitude, and the date when observations start, are listed in the table to the right of the map.

Study region with GTSM-ERA5 output locations marked as black circles and tide gauge locations marked as blue squares. Gray labels denote NOAA designated tide gauge station IDs. Information on tide gauges, including ID number, latitude, longitude, and the date when observations start, are listed in the table to the right of the map.

Graph showing component contributions to extreme water levels

Component contributions to extreme water levels. Panel (a) shows GTSM-ERA5 stations (in black) with highlighted “multi-POT” node locations marked in red and numbered to correspond with panel (c).

Component contributions to extreme water levels. Panel (a) shows GTSM-ERA5 stations (in black) with highlighted “multi-POT” node locations marked in red and numbered to correspond with panel (c).

Was this page helpful?