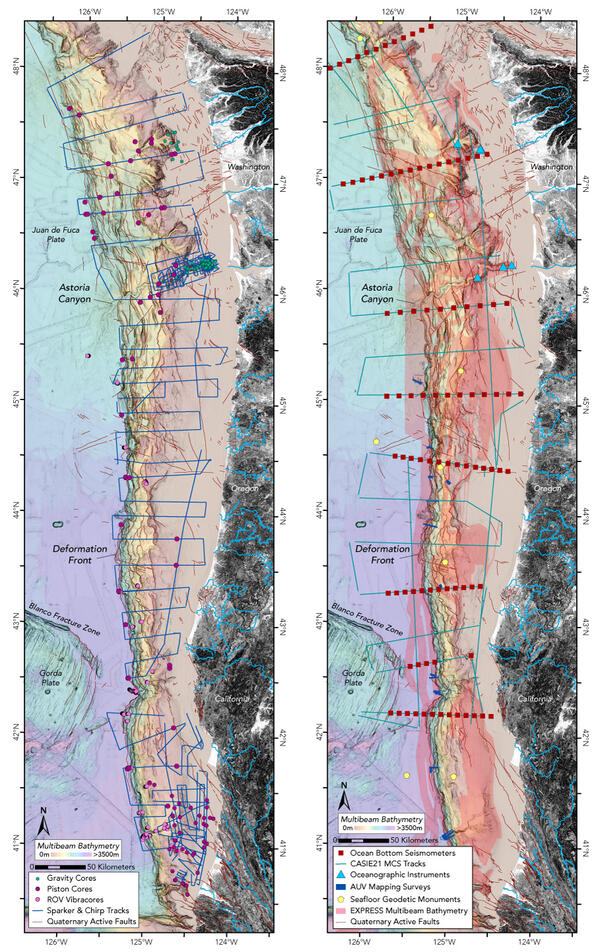
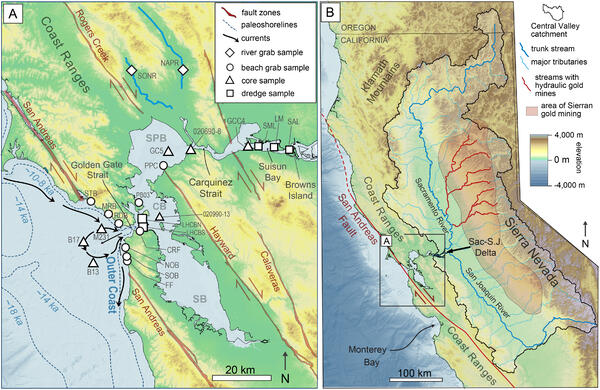
Oil drilling platform offshore of Huntington Beach, California
Oil drilling platform offshore of Huntington Beach, CaliforniaImage of an oil drilling platform offshore of Huntington Beach, California, with the sun setting behind it.
An official website of the United States government
Here's how you know
Official websites use .gov
A .gov website belongs to an official government organization in the United States.
Secure .gov websites use HTTPS
A lock () or https:// means you’ve safely connected to the .gov website. Share sensitive information only on official, secure websites.
Pacific Coastal and Marine Science Center images.
Image of an oil drilling platform offshore of Huntington Beach, California, with the sun setting behind it.
On April 19, 2024, in Santa Barbara, California, Susan Zaleski, Donna Schroeder, Dr. Guy Cochrane, and Dr. Mark Page all received FBI Director’s Awards for their participation in the Huntington Beach oil spill case. From left to right, USERT lead Ty Summers, Special Agent Ketrin Adam, Assistant Agent in Charge Sean Haworth, Dr. Guy Cochrane, Donna Schroeder, Dr.
Animated GIF showing corrected thermal imagery of a groundwater plume discharging onto a reef at Ofu, American Samoa.
Scientists viewing data from a thermal camera installed in the National Park of American Samoa on Ofu.
Graph showing corrected thermal camera imagery from the National Park of American Samoa on Ofu.
Scientists installing a wind and rain gauge in the National Park of American Samoa on Ofu.
Map of Ofu, American Samoa, showing study sites to investigate outbreaks of Valonia fastigiata algae.
Thermal camera tower method. 1) Original oblique view data 2) Orthorectified nadir view 3) thermal corrections for angular and distance dependence 4) Calibrated thermal image.
Coral cores collected within the National Park of American Samoa on the island of Ofu.
Scientists installing thermal camera in the National Park of American Samoa on Ofu.
USGS and NPS scientists collecting a coral core within the National Park of American Samoa on Ofu.
Underwater image of Valonia fastigiata algae growing on a reef in the National Park of American Samoa on Ofu.
Aerial image of a reef flat on Ofu, American Samoa, from a thermal drone that captures both regular images and radiometric images.
Diagram showing oceanographic and hydrogeologic processes including submarine groundwater discharge on Ofu, American Samoa.
Scientists conducting Electrical Resistivity Tomography surveys in American Samoa.
Chart showing relative flood risk per county as a function of sea level rise, from the study Tropical or extratropical cyclones: what drives the compound flood hazard, impact, and risk for the United States Southeast Atlantic coast?
Graphic showing geographic location of four benchmarking sites used in the study Benchmarking satellite-derived shoreline mapping algorithms.
Study region with GTSM-ERA5 output locations marked as black circles and tide gauge locations marked as blue squares. Gray labels denote NOAA designated tide gauge station IDs. Information on tide gauges, including ID number, latitude, longitude, and the date when observations start, are listed in the table to the right of the map.
Component contributions to extreme water levels. Panel (a) shows GTSM-ERA5 stations (in black) with highlighted “multi-POT” node locations marked in red and numbered to correspond with panel (c).
Map of highest storm-driven flood impact category in 63 Alaska coastal communities for flood events from 1887 to 2022, from the study Current and projected flood exposure for Alaska coastal communities.
Cover image for the geonarrative "Paleoclimate: Lessons from the past, roadmap for the future". In this interactive geonarrative, viewers can explore the different applications of USGS paleoclimate research.