
Scientists and technicians from the Woods Hole Coastal and Marine Science Center (WHCMSC) in Woods Hole, Massachusetts traveled to the Pacific Coastal and Marine Science Center (PCMSC) in Santa Cruz, California to learn about their seafloor imaging and sampling instrument—the Benthic Observation camera Sled, or BOBSled.
Images
Pacific Coastal and Marine Science Center images.
Filter Total Items: 1387

Viewing BOBSled
Scientists and technicians from the Woods Hole Coastal and Marine Science Center (WHCMSC) in Woods Hole, Massachusetts traveled to the Pacific Coastal and Marine Science Center (PCMSC) in Santa Cruz, California to learn about their seafloor imaging and sampling instrument—the Benthic Observation camera Sled, or BOBSled.
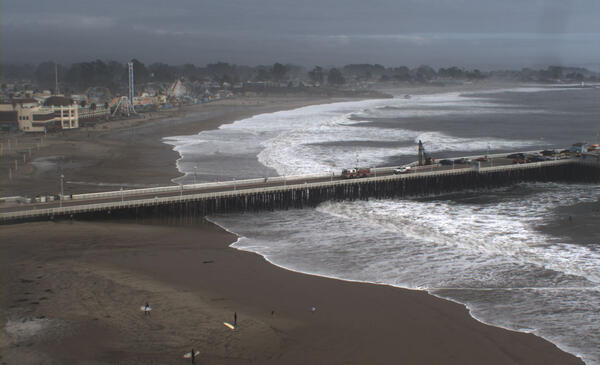
Image of Santa Cruz wharf during Dec 23 2024 storm taken from a CoastCam atop the Dream Inn hotel
Image of Santa Cruz wharf during Dec 23 2024 storm taken from a CoastCam atop the Dream Inn hotelImage of Santa Cruz wharf during Dec 23 2024 storm taken from a CoastCam atop the Dream Inn hotel.
Image of Santa Cruz wharf during Dec 23 2024 storm taken from a CoastCam atop the Dream Inn hotel
Image of Santa Cruz wharf during Dec 23 2024 storm taken from a CoastCam atop the Dream Inn hotelImage of Santa Cruz wharf during Dec 23 2024 storm taken from a CoastCam atop the Dream Inn hotel.
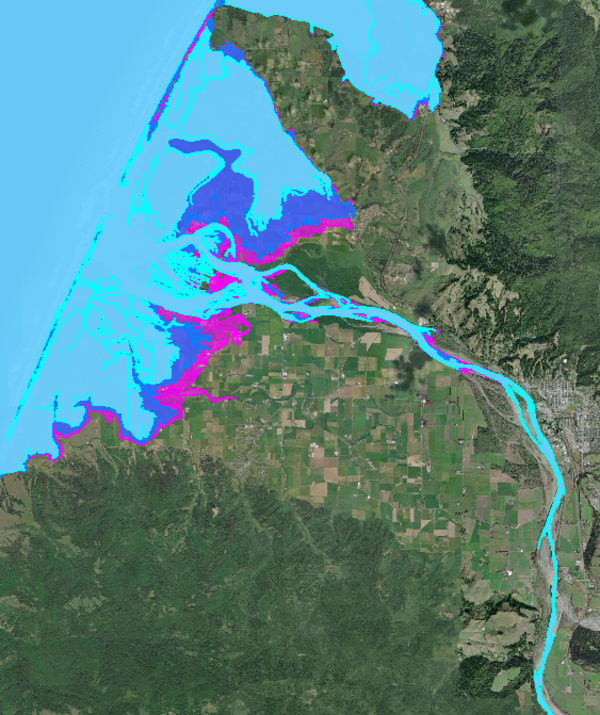
CoSMoS flood extent map
Example CoSMoS flood extent map products for the Humboldt County region, showing a 100-year storm across three sea-level rise scenarios.
Example CoSMoS flood extent map products for the Humboldt County region, showing a 100-year storm across three sea-level rise scenarios.
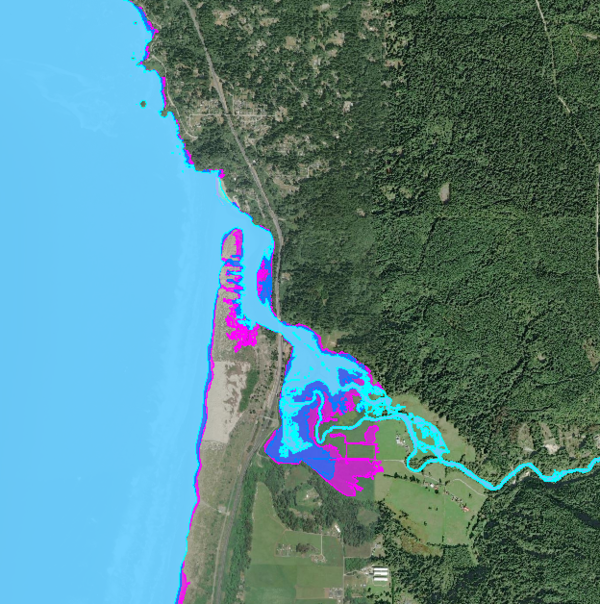
CoSMoS flood extent map
Example CoSMoS flood extent map products for the Humboldt County region, showing a 100-year storm across three sea-level rise scenarios.
Example CoSMoS flood extent map products for the Humboldt County region, showing a 100-year storm across three sea-level rise scenarios.
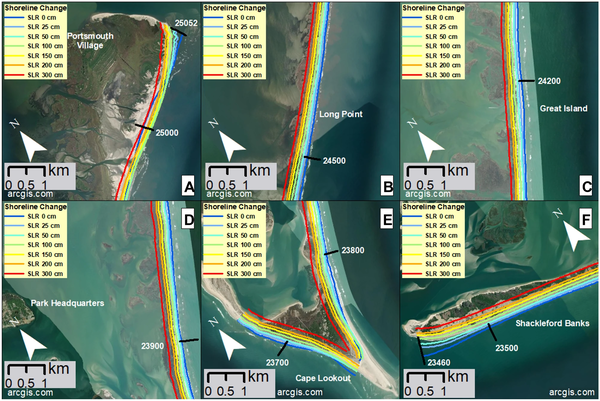
Modeled shoreline change projections at Cape Lookout National Seashore
Modeled shoreline change projections at Cape Lookout National SeashoreModeled shoreline change projections overlayed onto maps of some key areas of Cape Lookout National Seashore. Note that the reference shoreline position from 1990 is not shown. Panel (A) shows the shoreline near the historic Portsmouth Village, at the northern extent of the islands, including a ferry terminal.
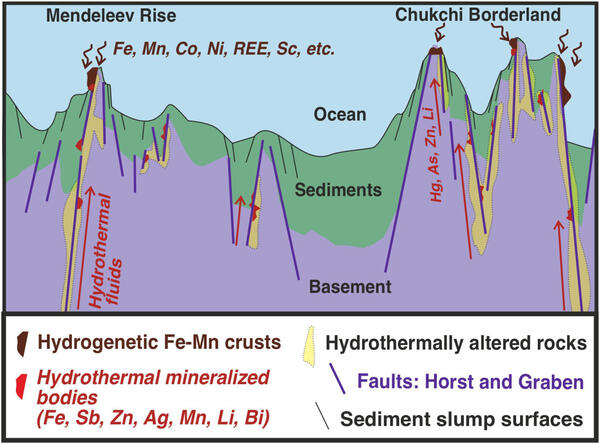
Schematic deposit model showing formation of hydrothermal minerals along faults
Schematic deposit model showing formation of hydrothermal minerals along faultsSchematic deposit model showing formation of hydrothermal Fe- and Mn-oxide deposits at depth along faults during the Neogene (∼8.5–4.8 Ma) from ascending hydrothermal fluids driven by frictional heating and other fault-related processes; the deposits may have experienced minor uplift along faults during the Neogene and Quaternary, and variably exposed as seaflo
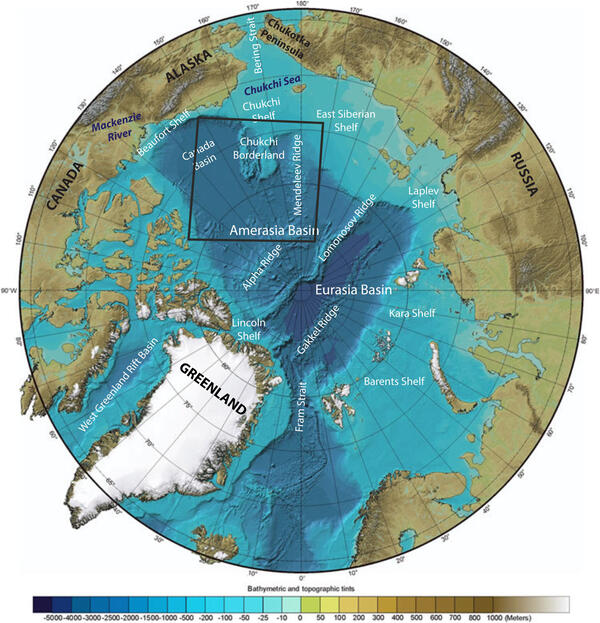
Regional location map and bathymetry of the Arctic Ocean
Regional location map and bathymetry of the Arctic OceanRegional location map and bathymetry of the Arctic Ocean with the study area delineated by the black rectangle (Base map, IASC, 2004).
Regional location map and bathymetry of the Arctic Ocean
Regional location map and bathymetry of the Arctic OceanRegional location map and bathymetry of the Arctic Ocean with the study area delineated by the black rectangle (Base map, IASC, 2004).
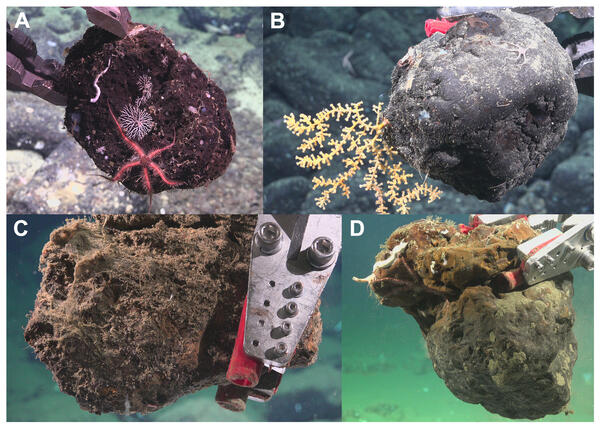
Photos of various deep-ocean substrate types upon collection
Photos of various deep-ocean substrate types upon collectionPhotos of each substrate type upon collection. (A) Basalt; (B) Ferromanganese (FeMn) crust; (C) Sedimentary; and (D) Phosphorite rock.
Photos of various deep-ocean substrate types upon collection
Photos of various deep-ocean substrate types upon collectionPhotos of each substrate type upon collection. (A) Basalt; (B) Ferromanganese (FeMn) crust; (C) Sedimentary; and (D) Phosphorite rock.
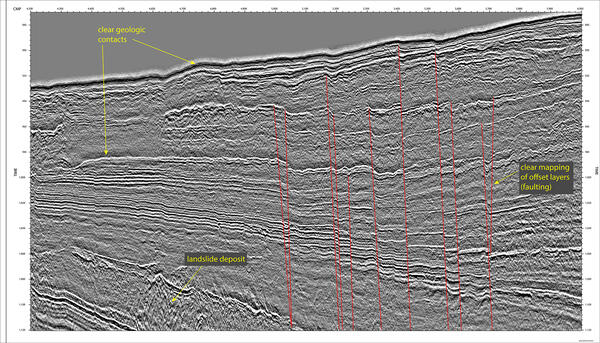
Cascadia sparker data with ghosts removed, with annotation identifying geologic contacts, offset layers, and a submarine landslide deposit
Cascadia sparker data with ghosts removed, with annotation identifying geologic contacts, offset layers, and a submarine landslide depositCascadia sparker data with ghosts removed, with annotation identifying geologic contacts, offset layers, and a submarine landslide deposit.
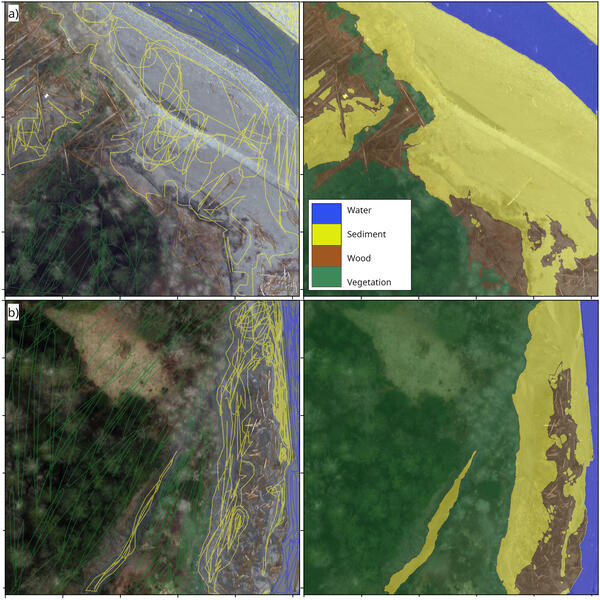
Example annotated orthoimagery of woody debris along the Elwha River
Example annotated orthoimagery of woody debris along the Elwha RiverExample annotated images (left column) and resulting label images (right column) made using the software program Doodler (Buscombe et al., 2021). Spacing between ticks is 200 pixels.
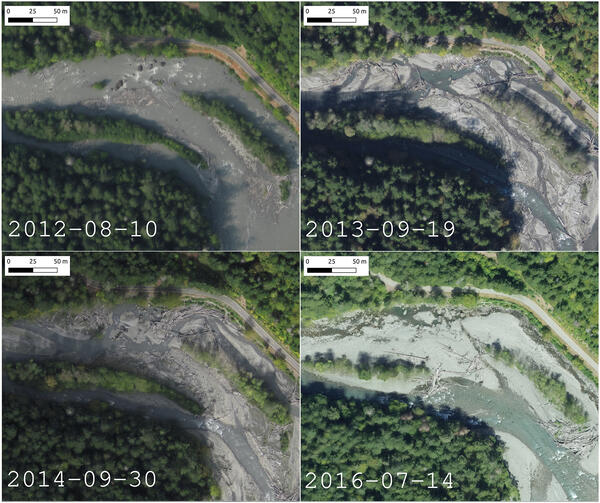
Example aerial orthoimagery of wood along Elwha River
Example aerial orthoimagery of wood along Elwha RiverExample aerial orthoimagery at a typical location (located in the middle reach of the Elwha River), showing the variation in color and brightness, as well as the nature of the channel, wood deposition, and bar growth.
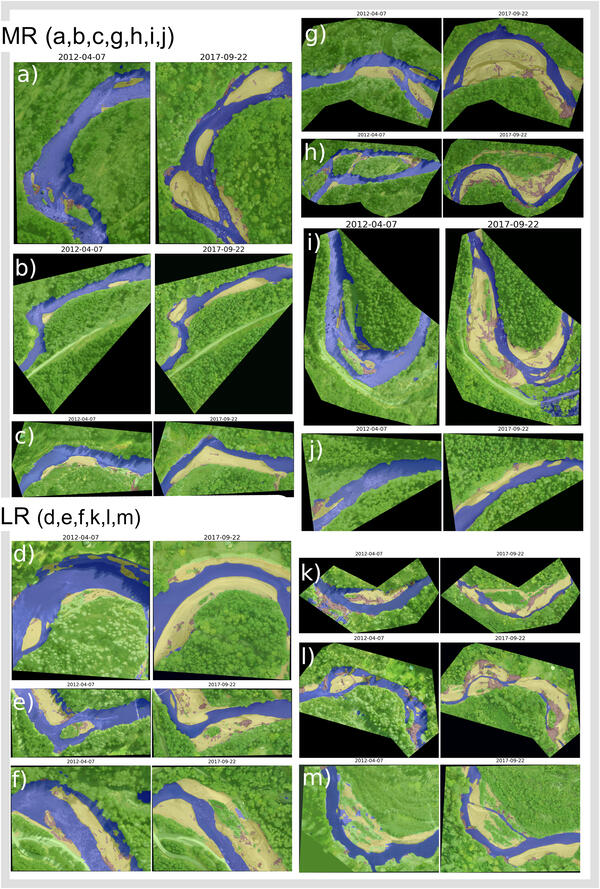
Elwha River woody debris example model output
Example model outputs for the first (2012-04-07) and last (2017-09-22) aerial survey from a selection of bars in the middle reach (MR) and lower reach (LR) of the Elwha River.
Example model outputs for the first (2012-04-07) and last (2017-09-22) aerial survey from a selection of bars in the middle reach (MR) and lower reach (LR) of the Elwha River.

Diagram showing paths that sound travels away from the sparker source
Diagram showing paths that sound travels away from the sparker sourceDiagram shows the paths that the sound travels away from the sparker source (black oval). The ghost reflections are shown in green and orange. PP= Primary Pulse, BP = Bubble Pulse. From the study Practical approaches to maximizing the resolution of sparker seismic reflection data.

Animated GIF of fault zone outcrop from late Miocene–Pliocene period, Western Macedonia, Greece
Animated GIF of fault zone outcrop from late Miocene–Pliocene period, Western Macedonia, GreeceAnimated GIF of fault zone outcrop from late Miocene–Pliocene period, Western Macedonia, Greece. Subsequent images are overlays that are offset with colors inverted, to simulate ghost reflections found in sparker seismic data.

Example sparker data from Cascadia Subduction Zone showing multiple ghost reflections
Example sparker data from Cascadia Subduction Zone showing multiple ghost reflectionsExample sparker data from Cascadia Subduction Zone showing multiple ghost reflections that reduce the overall resolution of the image.
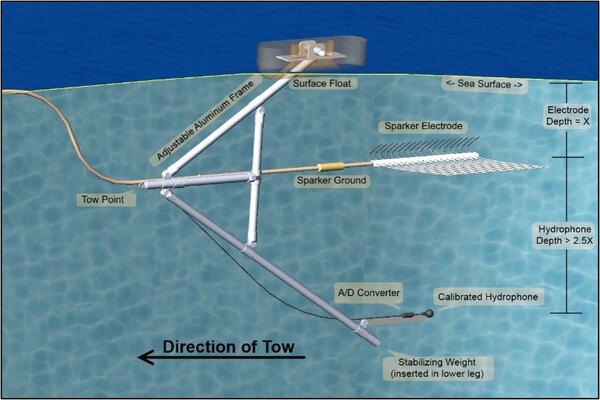
Diagram of ghostbuster system designed to record signature of outgoing sparker source
Diagram of ghostbuster system designed to record signature of outgoing sparker sourceDiagram of system designed to record signature of outgoing sparker source, from the study Practical approaches to maximizing the resolution of sparker seismic reflection data.
Sub seafloor structure of landslide in Santa Barbara Channel, CA
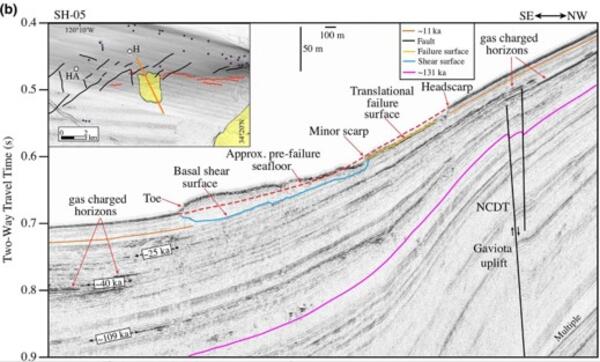
Sub seafloor structure of landslide in Santa Barbara Channel, CAExample imagery revealing the sub-seafloor structure below a submarine landslide in the Santa Barbara Channel, offshore California. The base of the slide is traced in blue, and the near vertical black lines highlight shallow faults cutting through a zone of uplift located below the slide headscarp.
Sub seafloor structure of landslide in Santa Barbara Channel, CA
Sub seafloor structure of landslide in Santa Barbara Channel, CAExample imagery revealing the sub-seafloor structure below a submarine landslide in the Santa Barbara Channel, offshore California. The base of the slide is traced in blue, and the near vertical black lines highlight shallow faults cutting through a zone of uplift located below the slide headscarp.

Companion Guide Cover
Cover of the Coastal Science Navigator Companion Guide. The guide introduces some of the many coastal change hazards-related products available through the USGS. In it, we showcase the products included in the Coastal Science Navigator’s initial publication in July 2023.
Cover of the Coastal Science Navigator Companion Guide. The guide introduces some of the many coastal change hazards-related products available through the USGS. In it, we showcase the products included in the Coastal Science Navigator’s initial publication in July 2023.
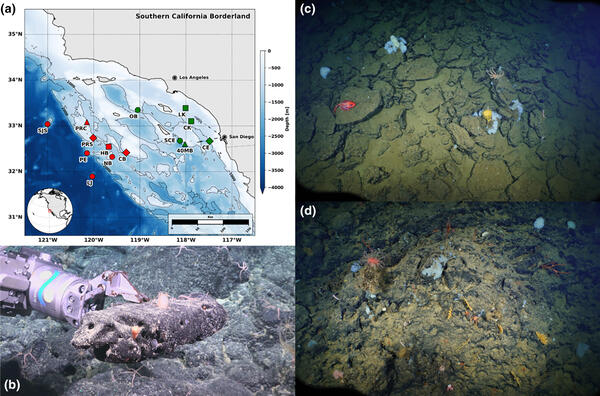
Diagram showing ROV images of sampling sites off the Southern California Borderland and map of study area
Diagram showing ROV images of sampling sites off the Southern California Borderland and map of study areaDiagram showing ROV images of sampling sites off the Southern California Borderland and map of study area, from the study Invertebrate trophic structure on marine ferromanganese and phosphorite hardgrounds.

Collecting topographic data on an all-terrain vehicle
Collecting topographic data on an all-terrain vehicleDiana McCandless, an environmental specialist with the Washington State Department of Ecology, collecting topographic data on an all-terrain vehicle.
Collecting topographic data on an all-terrain vehicle
Collecting topographic data on an all-terrain vehicleDiana McCandless, an environmental specialist with the Washington State Department of Ecology, collecting topographic data on an all-terrain vehicle.

Topographic beach survey at dawn
Paige Hovenga, former Graduate Research Assistant at Oregon State University, participating in a dawn topographic survey.
Paige Hovenga, former Graduate Research Assistant at Oregon State University, participating in a dawn topographic survey.