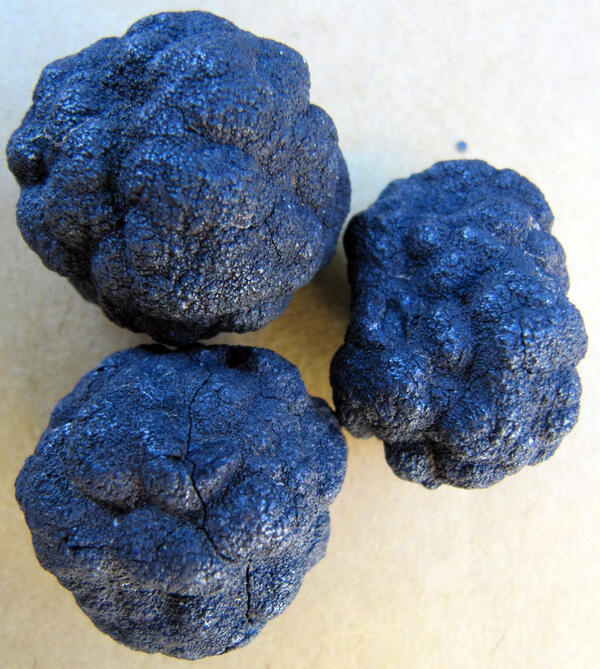
U.S. flag

An official website of the United States government

Images

Pacific Coastal and Marine Science Center images.

Filter Total Items: 1342
Map of study area showing Grays Harbor and Columbia River Mouth

Maps of study area showing, A, extents of nested wave model grids (Tiers 1-3), locations of bathymetric and topographic survey lines, wave buoys, and tide gauges. Black boxes provide the locations of the detail areas shown in B-C. B-C, Maps showing bathymetry of the engineered inlets of B, Grays Harbor, and C, the Columbia River.

Maps of study area showing, A, extents of nested wave model grids (Tiers 1-3), locations of bathymetric and topographic survey lines, wave buoys, and tide gauges. Black boxes provide the locations of the detail areas shown in B-C. B-C, Maps showing bathymetry of the engineered inlets of B, Grays Harbor, and C, the Columbia River.

Close-up photo of pore water extraction from a surface marine sediment sample
Map of HI Abyssal Nodules Expedition study area

Map showing study area (outlined in yellow) of the Hawaii Abyssal Nodules and Associated Ecosystems Expedition.

Bathymetric map showing study area for the Hawaiʻi Abyssal Nodules and Associated Ecosystems Expedition
Hawaiʻi Abyssal Nodules and Associated Ecosystems Expedition study area
Map showing results of geomorphic change detection analysis of sediment volume differences between 2016 and 2017, Upper Carmel River
Results of geomorphic change detection analysis of sediment volume differences between 2016 and 2017, Upper Carmel River

Results of geomorphic change detection analysis of sediment volume differences between 2016 and 2017, Upper Carmel River, from the study Post-Fire Sediment Yield From a Central California Watershed: Field Measurements and Validation of the WEPP Model.

Photo of a post-fire debris flow depositing ash and sediment on a steep hillside
Post-fire debris flow, 2021 Dixie Fire in northern CA

Post-fire debris flow depositing ash and sediment on a steep hillside,  2021 Dixie Fire in northern CA.

Underwater footage of manganese nodules on seafloor
Cover image for Marine Minerals b-roll - Manganese Nodules

Underwater footage of manganese nodules on seafloor, taken from a remotely operated vehicle.

Underwater footage of marine phosphorites on seafloor
Cover image for Marine minerals b-roll - Marine Phosphorites

Underwater footage of marine phosphorites on seafloor, taken from a remotely operated vehicle.

Underwater footage of ferromanganese crust on seafloor, taken from a remotely operated vehicle
Cover image for Marine Minerals b-roll - Ferromanganese Crusts
Graph showing Pleistocene to Holocene chronology of the San Francisco (San Francisco) Bay region
Pleistocene to Holocene chronology of the San Francisco Bay region

Pleistocene to Holocene chronology of the San Francisco (San Francisco) Bay region highlighting sea level fluctuations and anthropogenic events.

Was this page helpful?