
Hurricane Sandy - Coastal System Change at Fire Island, New York
USGS used several techniques to quantify the impacts of Hurricane Sandy on the ocean shoreline of Fire Island.
Continuous alongshore differential global positioning system (DGPS) data were collected in order to examine how the position of the shoreline changed in response to Hurricane Sandy. Contrary to expectations, the data and corresponding statistics indicate that the shoreline moved seaward right after the storm (blue line). However, the shoreline eroded significantly over the following winter, retreating by 35.3 m on average with a maximum of 66.9 m of retreat. The red and green bars on the table approximately represent the percent of the study area that accreted (moved seaward) or retreated (moved landward) for each time period.

Shoreline Change Statistics: Hurricane Sandy and Beyond
| Time Period | Avg (m) | Accretion Max (m) | Accretion Avg (m) | Erosion max (m) | Erosion Avg (m) |
|---|---|---|---|---|---|
| Hurricane Sandy (Oct 27 2012* to Nov 05 2012*) Transect Distribution: 89%(+)/11%(-) |
9.9 (28.0 km) |
43.7 | 12.1 | -22.4 | -6.6 |
| Winter (Nov 05 2012* to March 13 2013) Transect Distribution: 3%(+)/97%(-) |
-35.3 (28.0 km) |
20.2 | 9.0 | -66.9 | -36.6 |
*Lidar data used in lieu of field data.
However, the change in the position of the shoreline is only part of the story; it doesn’t tell us how much elevation the beaches and dunes lost as a result of the storm. To quantify beach and dune elevation loss associated with Sandy, differential global positioning system (DGPS) elevation data were collected along 15 shore-perpendicular profiles. The beach profiles extended from just inland of the dune to the low-tide swash zone. Collection of profiles continued through 2017 to monitor beach recovery. Pre- and post-Sandy beach profiles show the dramatic flattening of dune and upper beach (loss of elevation) in response to the storm despite the fact that the shoreline prograded seaward (note where profiles intersect the mean high water (MHW) line before and after the storm).

Overwash Mapping
In addition to moving the shoreline and leveling dunes, Hurricane Sandy carried substantial volumes of sand to the interior and back-bay areas of Fire Island through a process called overwash. Several different “styles” of overwash were observed along the island. In the western portion of the island (A), overwash processes resulted in washover sheets, or wide deposits that are somewhat continuous alongshore. The inland distance of the overwash along western Fire Island was limited in many locations by private homes and other community infrastructure in the developed stretches of coast. In the central portion of Fire Island (B), the occurrence of overwash is relatively low and is confined to narrow channels that coincide with existing cuts in the dunes (vehicle access points or other lows). Volumes of overwash are also significantly lower in the central portion, likely due to the higher overall pre-Sandy dune and island elevations and (or) lower waves and storm surge along this segment of the island compared to adjacent areas. Eastern Fire Island (C) experienced the greatest amount of overwash and inundation. In areas with high pre-Sandy dunes, surge channels cut through the dunes and carried large volumes of material to the island interior, deposited as overwash fans. In lower-lying portions, continuous overwash fans and fields of overlapping overwash tongues extend across the width of the barrier island.

In order to determine how much was lost from the beach system to build habitat and elevation behind the dunes, a combination of field observations, remote sensing, and GIS analytical techniques was used. The USGS worked with National Park Service staff and volunteers at Fire Island National Seashore to create a dataset of overwash deposit thicknesses. A total of 797 thickness measurements were obtained used to create overwash thickness maps. The results of this method indicate an estimated 510,000 cubic meters (m3) of sand was transported from the primary dunes and beaches to the island interior during Sandy (see gallery below).


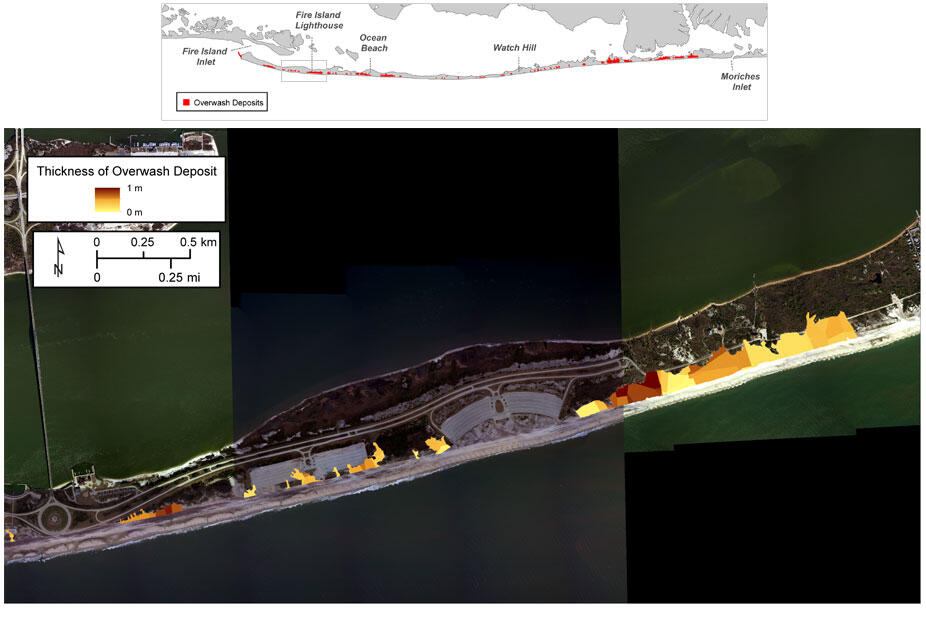

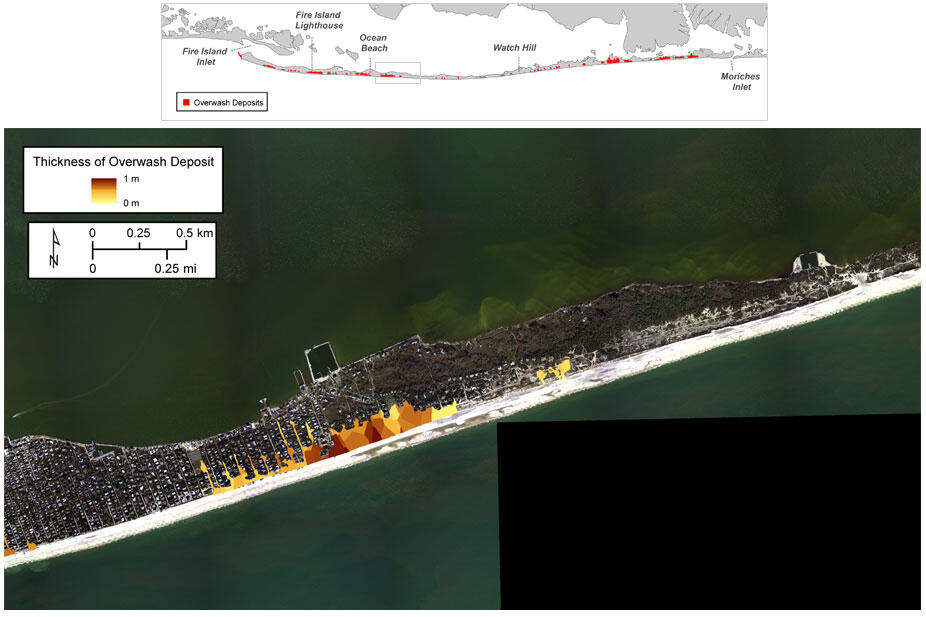

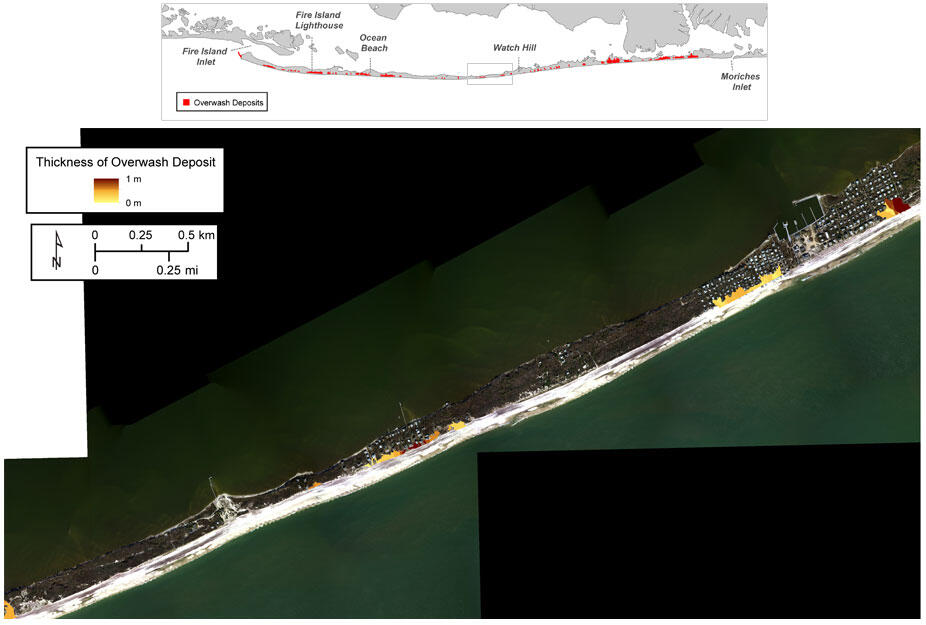

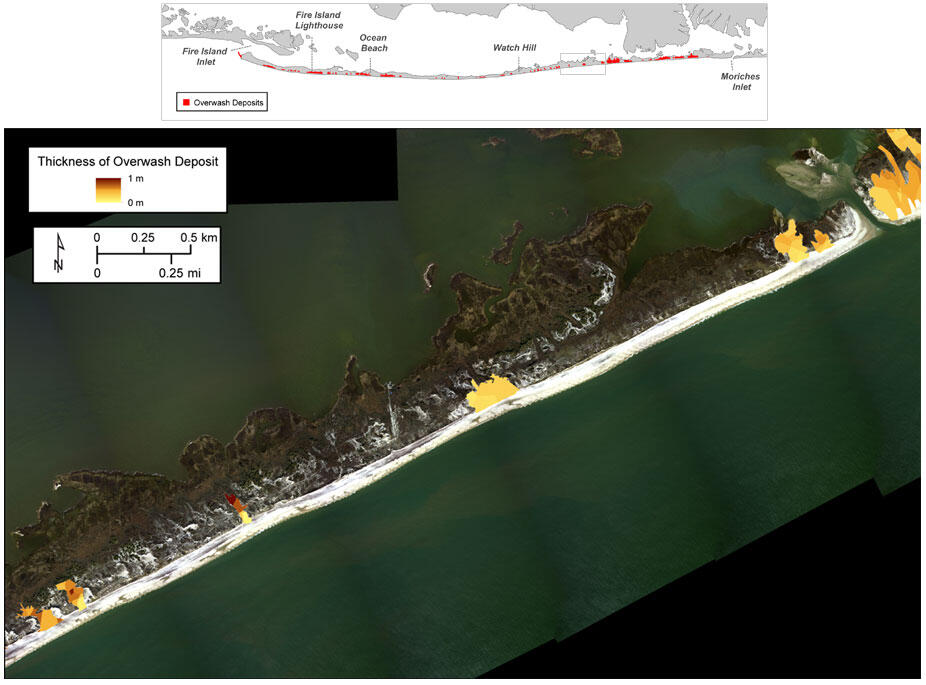

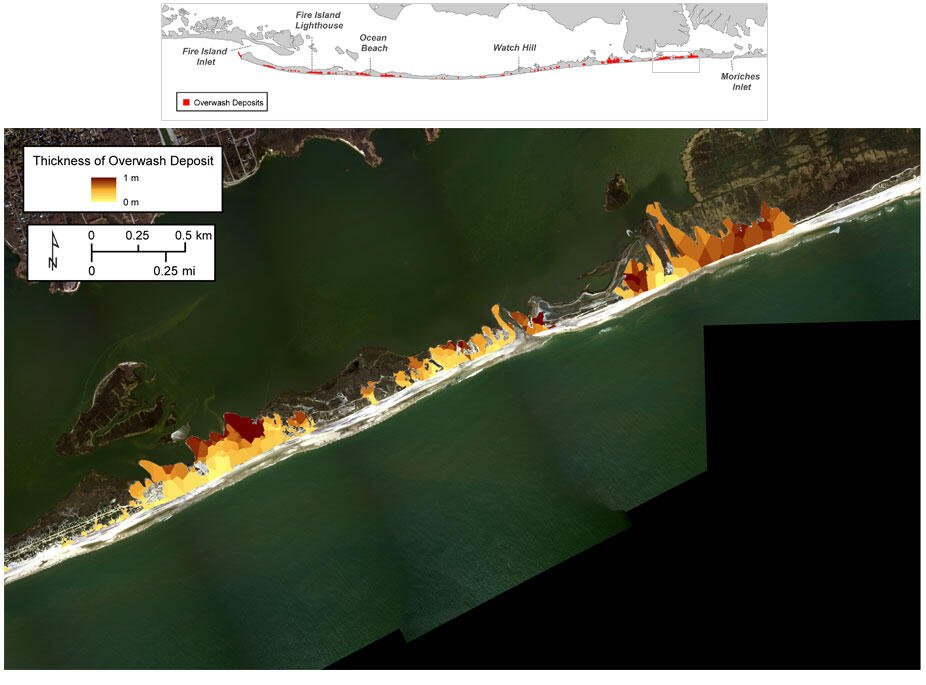

Additionally, USGS used pre- (May 2012) and post-Sandy (Nov. 2012) lidar data to calculate profile-based volume loss from the active beaches and dunes. This analysis indicates that Sandy moved or removed 3,500,000 cubic meters (m3) of sand from the beach and dune system. Putting ground-based and lidar-based estimations together, it can be determined that only 14% of the volume of sand removed during Sandy was deposited as washover. The remaining material was transported offshore and downcoast. The USGS is continuing to monitor the beaches and dunes to evaluate how much of the sand removed by Sandy returns to the beach via natural beach-building processes (see Shoreline Change and Beach Profiles).
Below are other science projects associated with this project.

Coastal System Change at Fire Island, New York

Back-barrier and Estuarine - Coastal System Change at Fire Island, New York

Oceanside Beaches and Dunes - Coastal System Change at Fire Island, New York

Open Ocean/Marine - Coastal System Change at Fire Island, New York

Nearshore - Coastal System Change at Fire Island, New York
USGS used several techniques to quantify the impacts of Hurricane Sandy on the ocean shoreline of Fire Island.
Continuous alongshore differential global positioning system (DGPS) data were collected in order to examine how the position of the shoreline changed in response to Hurricane Sandy. Contrary to expectations, the data and corresponding statistics indicate that the shoreline moved seaward right after the storm (blue line). However, the shoreline eroded significantly over the following winter, retreating by 35.3 m on average with a maximum of 66.9 m of retreat. The red and green bars on the table approximately represent the percent of the study area that accreted (moved seaward) or retreated (moved landward) for each time period.
Shoreline Change Statistics: Hurricane Sandy and Beyond
| Time Period | Avg (m) | Accretion Max (m) | Accretion Avg (m) | Erosion max (m) | Erosion Avg (m) |
|---|---|---|---|---|---|
| Hurricane Sandy (Oct 27 2012* to Nov 05 2012*) Transect Distribution: 89%(+)/11%(-) |
9.9 (28.0 km) |
43.7 | 12.1 | -22.4 | -6.6 |
| Winter (Nov 05 2012* to March 13 2013) Transect Distribution: 3%(+)/97%(-) |
-35.3 (28.0 km) |
20.2 | 9.0 | -66.9 | -36.6 |
*Lidar data used in lieu of field data.
However, the change in the position of the shoreline is only part of the story; it doesn’t tell us how much elevation the beaches and dunes lost as a result of the storm. To quantify beach and dune elevation loss associated with Sandy, differential global positioning system (DGPS) elevation data were collected along 15 shore-perpendicular profiles. The beach profiles extended from just inland of the dune to the low-tide swash zone. Collection of profiles continued through 2017 to monitor beach recovery. Pre- and post-Sandy beach profiles show the dramatic flattening of dune and upper beach (loss of elevation) in response to the storm despite the fact that the shoreline prograded seaward (note where profiles intersect the mean high water (MHW) line before and after the storm).
Overwash Mapping
In addition to moving the shoreline and leveling dunes, Hurricane Sandy carried substantial volumes of sand to the interior and back-bay areas of Fire Island through a process called overwash. Several different “styles” of overwash were observed along the island. In the western portion of the island (A), overwash processes resulted in washover sheets, or wide deposits that are somewhat continuous alongshore. The inland distance of the overwash along western Fire Island was limited in many locations by private homes and other community infrastructure in the developed stretches of coast. In the central portion of Fire Island (B), the occurrence of overwash is relatively low and is confined to narrow channels that coincide with existing cuts in the dunes (vehicle access points or other lows). Volumes of overwash are also significantly lower in the central portion, likely due to the higher overall pre-Sandy dune and island elevations and (or) lower waves and storm surge along this segment of the island compared to adjacent areas. Eastern Fire Island (C) experienced the greatest amount of overwash and inundation. In areas with high pre-Sandy dunes, surge channels cut through the dunes and carried large volumes of material to the island interior, deposited as overwash fans. In lower-lying portions, continuous overwash fans and fields of overlapping overwash tongues extend across the width of the barrier island.
In order to determine how much was lost from the beach system to build habitat and elevation behind the dunes, a combination of field observations, remote sensing, and GIS analytical techniques was used. The USGS worked with National Park Service staff and volunteers at Fire Island National Seashore to create a dataset of overwash deposit thicknesses. A total of 797 thickness measurements were obtained used to create overwash thickness maps. The results of this method indicate an estimated 510,000 cubic meters (m3) of sand was transported from the primary dunes and beaches to the island interior during Sandy (see gallery below).
Additionally, USGS used pre- (May 2012) and post-Sandy (Nov. 2012) lidar data to calculate profile-based volume loss from the active beaches and dunes. This analysis indicates that Sandy moved or removed 3,500,000 cubic meters (m3) of sand from the beach and dune system. Putting ground-based and lidar-based estimations together, it can be determined that only 14% of the volume of sand removed during Sandy was deposited as washover. The remaining material was transported offshore and downcoast. The USGS is continuing to monitor the beaches and dunes to evaluate how much of the sand removed by Sandy returns to the beach via natural beach-building processes (see Shoreline Change and Beach Profiles).
Below are other science projects associated with this project.
Coastal System Change at Fire Island, New York
Back-barrier and Estuarine - Coastal System Change at Fire Island, New York
Oceanside Beaches and Dunes - Coastal System Change at Fire Island, New York
Open Ocean/Marine - Coastal System Change at Fire Island, New York