
Figure 2.
Images
Western Geographic Science Center images.
Filter Total Items: 211
Las Moras.jpg
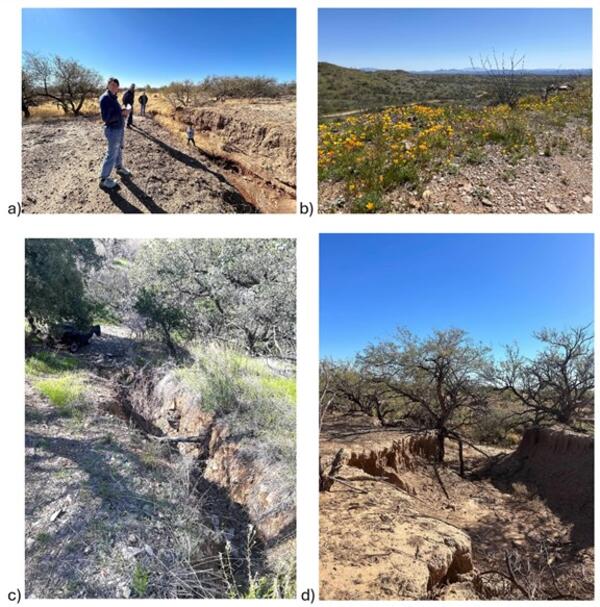
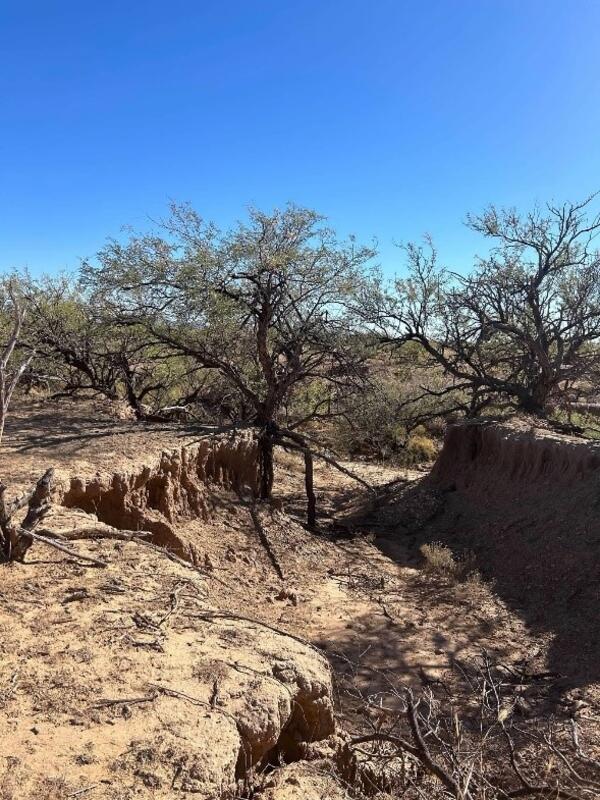
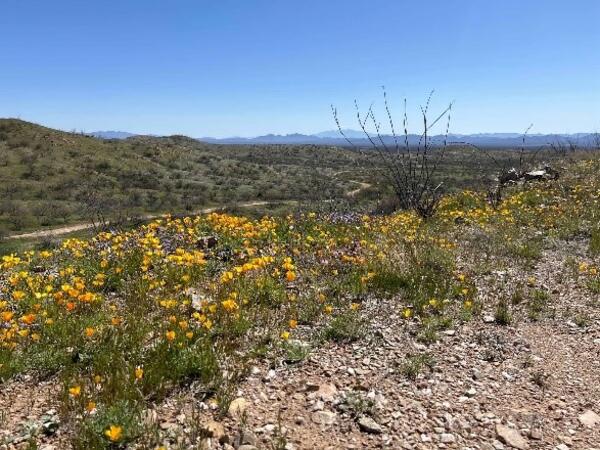
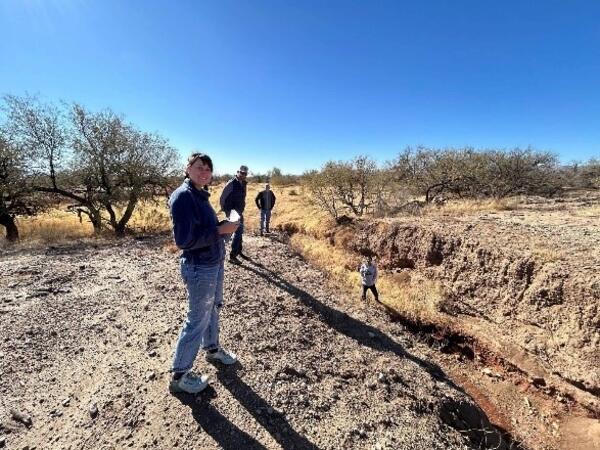
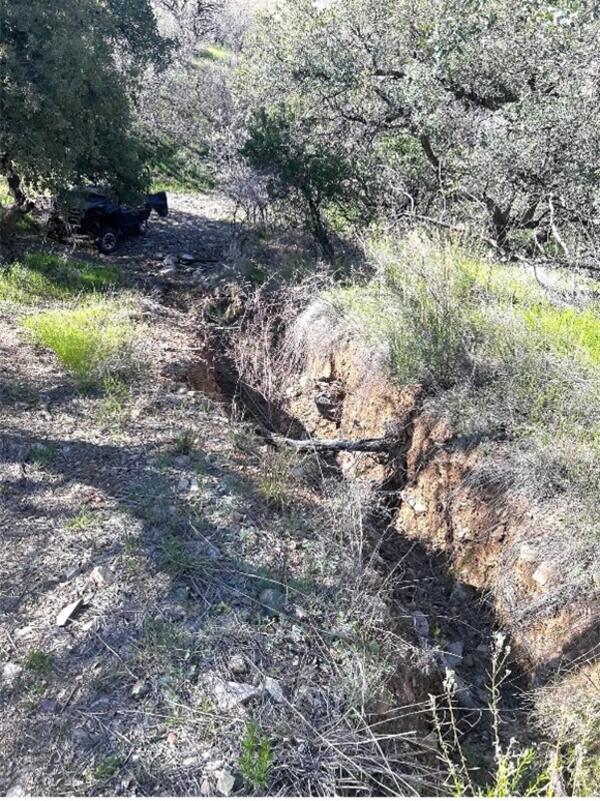
The Las Moras Wash, within the Santa Margarita Ranch, Altar Valley, AZ, exhibits channel incision, gully expansion, head‑cut migration, vegetation loss, and reduced hydrologic connectivity between upper watershed and floodplains
The Las Moras Wash, within the Santa Margarita Ranch, Altar Valley, AZ, exhibits channel incision, gully expansion, head‑cut migration, vegetation loss, and reduced hydrologic connectivity between upper watershed and floodplains
las moras fig 1.jpg
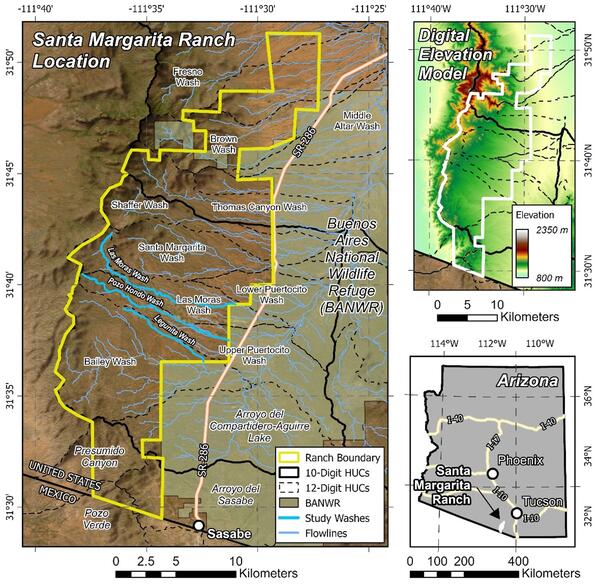
Figure 1. Location map showing the study area and property boundary of the Santa Margarita Ranch
Figure 1. Location map showing the study area and property boundary of the Santa Margarita Ranch
Las Moras b.jpg - Copy - Copy
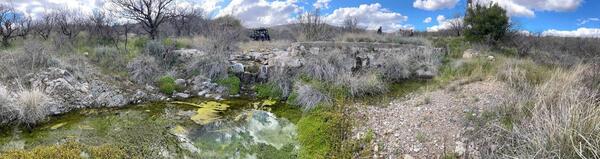
Figure 2.
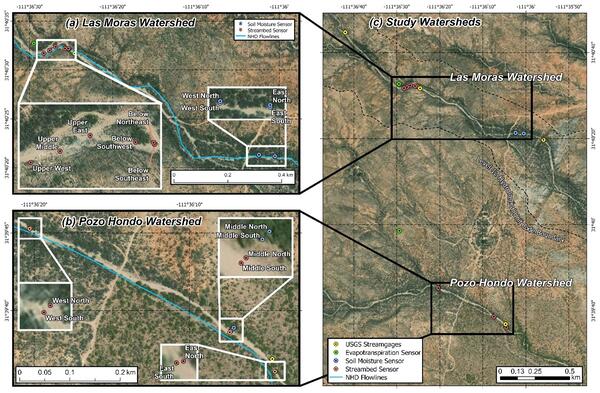
las moras fig 3.jpg
Figure 3. Map of paired watershed monitoring devices INSTALLED AT Santa Margarita Ranch.
Figure 3. Map of paired watershed monitoring devices INSTALLED AT Santa Margarita Ranch.
Las Moras b.jpg - Copy
Figure 2.

Pardhasaradhi Teleguntla receiving certificate of ESRI's Award for Best Scientific Paper in GIS -1st Place
Pardhasaradhi Teleguntla receiving certificate of ESRI's Award for Best Scientific Paper in GIS -1st PlacePardhasaradhi Teluguntla receieving certificate of ESRI's Award for Best Scientific Paper in GIS -1st Place. Picture taken at ASPRS Awards Ceremony held in Denver, CO on 02/17/2026.

GFSAD Contributors at ASPRS Awards Ceremony
Contributors of the Landsat-Derived Rainfed and Irrigated-Area Product for Conterminous United States for the Year 2020 (LRIP30 CONUS 2020) attending the ASPRS Awards Ceremony held in Denver, CO as the paper won 1st place in ESRI's award for Best Scientific Paper in GIS.
Contributors of the Landsat-Derived Rainfed and Irrigated-Area Product for Conterminous United States for the Year 2020 (LRIP30 CONUS 2020) attending the ASPRS Awards Ceremony held in Denver, CO as the paper won 1st place in ESRI's award for Best Scientific Paper in GIS.
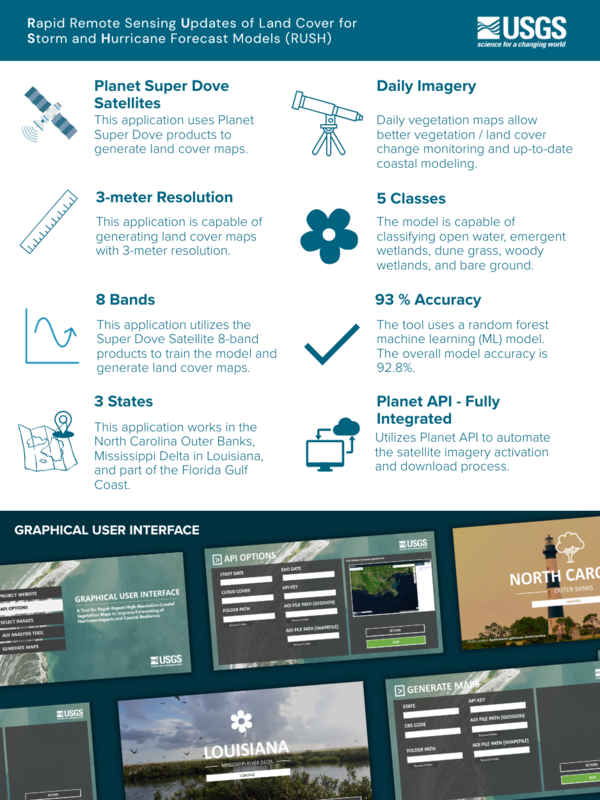
Rapid remote sensing Updates of land cover for Storm and Hurricane forecast models (RUSH) tool fact sheet
Rapid remote sensing Updates of land cover for Storm and Hurricane forecast models (RUSH) tool fact sheetA fact sheet that shows the RUSH tool’s characteristics and graphical user interface.
Rapid remote sensing Updates of land cover for Storm and Hurricane forecast models (RUSH) tool fact sheet
Rapid remote sensing Updates of land cover for Storm and Hurricane forecast models (RUSH) tool fact sheetA fact sheet that shows the RUSH tool’s characteristics and graphical user interface.
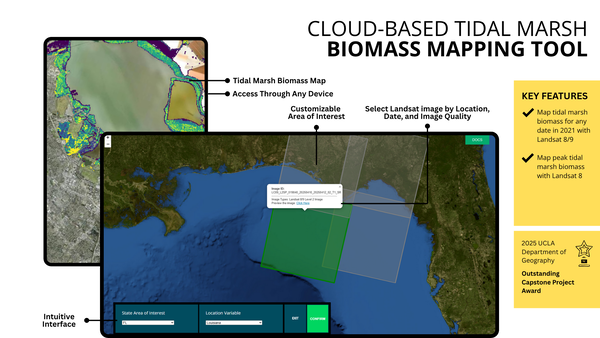
Cloud-based Tidal Marsh Biomass Mapping Tool Description
Cloud-based Tidal Marsh Biomass Mapping Tool DescriptionThe graphical user interface of the Cloud-based tidal marsh biomass mapping tool that highlights features and map outputs.
Cloud-based Tidal Marsh Biomass Mapping Tool Description
Cloud-based Tidal Marsh Biomass Mapping Tool DescriptionThe graphical user interface of the Cloud-based tidal marsh biomass mapping tool that highlights features and map outputs.
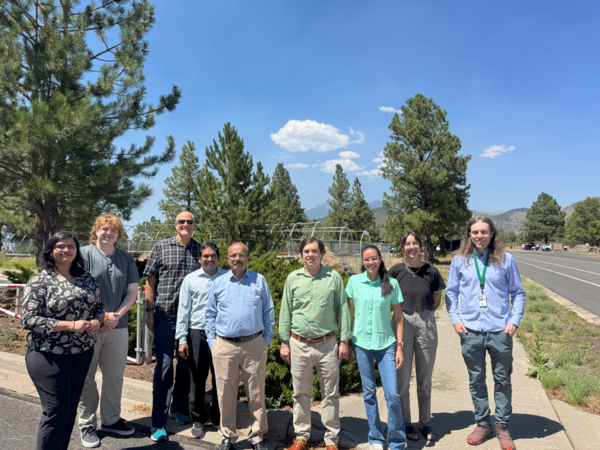
Attendees of GFSAD Workshop 4 Day One
The GFSAD is a NASA funded project (2023-2028) to provide highest-resolution global cropland data and their water use that contributes towards global food-and-water security in the twenty-first century. This image was taken after day one of the 4th GFSAD project workshop hosted in Flagstaff, Arizona.
The GFSAD is a NASA funded project (2023-2028) to provide highest-resolution global cropland data and their water use that contributes towards global food-and-water security in the twenty-first century. This image was taken after day one of the 4th GFSAD project workshop hosted in Flagstaff, Arizona.

Overview of GFSAD Project Accomplishments and Plans Ahead
Overview of GFSAD Project Accomplishments and Plans AheadThe GFSAD is a NASA funded project (2023-2028) to provide highest-resolution global cropland data and their water use that contributes towards global food-and-water security in the twenty-first century. This image is from the GFSAD project members' 4th workshop hosted in Flagstaff, Arizona where Dr.
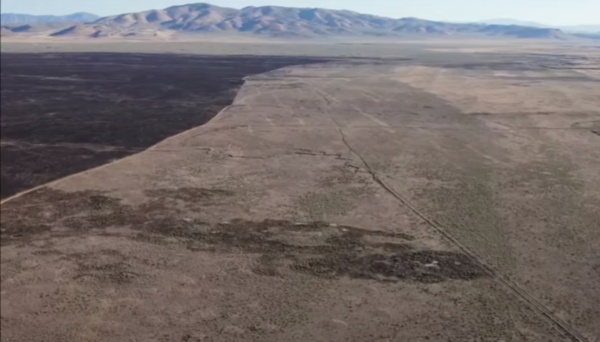
Fire stopped through active suppression
A fire stopped through active suppression activities at a fuel break in Idaho.
A fire stopped through active suppression activities at a fuel break in Idaho.
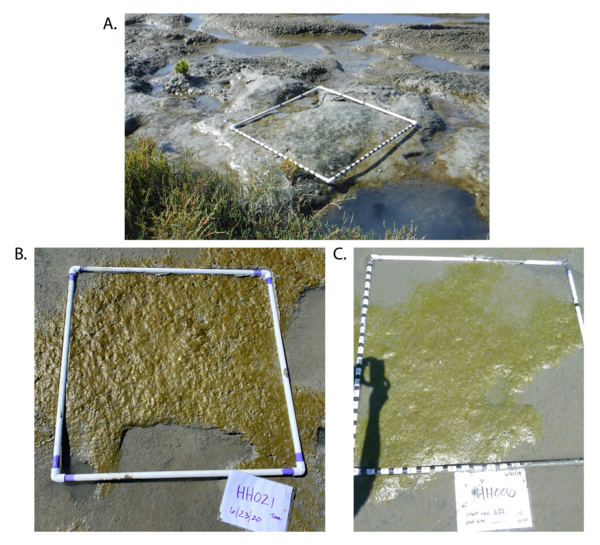
Examples of three types of intertidal biofilms observed at study sites with varying pigmentation
Examples of three types of intertidal biofilms observed at study sites with varying pigmentationExamples of three types of intertidal biofilms observed at study sites with varying pigmentation. (a) Dark gray-greens are indicative of cyanobacteria; (b) Golden brown is indicative of diatoms; (c) Bright green is indicative of chlorophytes.

Western sandpiper foraging on a mudflat
Western sandpiper foraging on a mudflat. This shorebird, which winters along coasts across the Americas and breeds in northern Alaska), may consume up to 20 percent of their body weight in biofilm per hour when fueling up for migration.
Western sandpiper foraging on a mudflat. This shorebird, which winters along coasts across the Americas and breeds in northern Alaska), may consume up to 20 percent of their body weight in biofilm per hour when fueling up for migration.
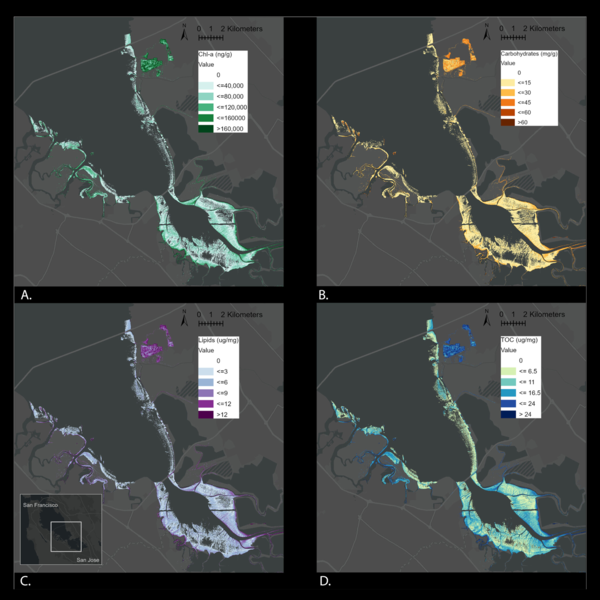
Maps of chlorophyll-a concentration, carbohydrates, lipids, and total organic carbon in southern San Francisco Bay
Maps of chlorophyll-a concentration, carbohydrates, lipids, and total organic carbon in southern San Francisco BayMaps of (a) chl-a concentration, (b) carbohydrates, (c) lipids, and (d) total organic carbon in southern San Francisco Bay, 15 April 2021, based on final partial least squares regression models and AVIRIS-NG 3.7 m imagery. Base map from Esri and its licensors, copyright 2022.

Estimated light absorption at 440nm, a proxy for the amount of colored dissolved organic matter in south San Francisco Bay waters
Estimated light absorption at 440nm, a proxy for the amount of colored dissolved organic matter in south San Francisco Bay watersMap showing estimated light absorption at 440nm, a proxy for the amount of colored dissolved organic matter in south San Francisco Bay waters. Project page: Remote Sensing of Mercury Pollution in South San Francisco Bay.

Unoccupied Aerial Systems (UAS) imagery of four monitoring plots at Palo Alto Battlefield, Texas
Unoccupied Aerial Systems (UAS) imagery of four monitoring plots at Palo Alto Battlefield, TexasHigh-resolution multispectral imagery collected in March 2024 by USGS of NPS vegetation monitoring plots at Palo Alto Battlefield in Brownsville, TX. The black boxes outline the sampling plot perimeter, and the green polygons outline patches of cordgrass (Spartina).
Unoccupied Aerial Systems (UAS) imagery of a monitoring plot at Palo Alto Battlefield, Texas
Unoccupied Aerial Systems (UAS) imagery of a monitoring plot at Palo Alto Battlefield, TexasHigh-resolution multispectral imagery collected in March 2024 by USGS of NPS vegetation monitoring plots at Palo Alto Battlefield in Brownsville, TX. The black boxes outline the sampling plot perimeter, and the green polygons outline patches of cordgrass (Spartina).