U.S. flag

An official website of the United States government

Images

Western Geographic Science Center images.

Filter Total Items: 212
An Unoccupied Aerial System image of the Palo Alto Battlefield, TX.
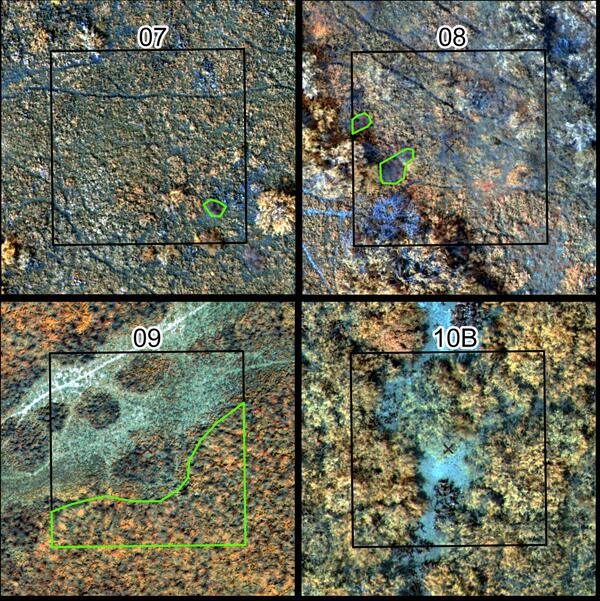
Unoccupied Aerial Systems (UAS) imagery of four monitoring plots at Palo Alto Battlefield, Texas

High-resolution multispectral imagery collected in March 2024 by USGS of NPS vegetation monitoring plots at Palo Alto Battlefield in Brownsville, TX. The black boxes outline the sampling plot perimeter, and the green polygons outline patches of cordgrass (Spartina).

Community members of the SCAT 2

Community members of the SCAT collecting tamarisk beetles on the Reservation (photo by Roy Petrakis, USGS) and USGS scientists teaching at the San Carlos Apache Tribe Summer Youth Practicum for Environmental Protection where the kids were talking about, learning about, and building NIDS (photo by Christy Sangster Begay, SCAT). 

Community members of the SCAT collecting tamarisk beetles on the Reservation (photo by Roy Petrakis, USGS) and USGS scientists teaching at the San Carlos Apache Tribe Summer Youth Practicum for Environmental Protection where the kids were talking about, learning about, and building NIDS (photo by Christy Sangster Begay, SCAT). 

San Carlos
San Carlos Partners
San Carlos Partners
San Carlos Partners

The USGS Western Geographic Science Center has been partnering with collaborators from the San Carlos Apache Tribe (SCAT) and Bureau of Indian Affairs (BIA) to address natural resource questions since 2004. We work with SCAT Departments of Forestry, Range Management and Environmental Protection. 

The USGS Western Geographic Science Center has been partnering with collaborators from the San Carlos Apache Tribe (SCAT) and Bureau of Indian Affairs (BIA) to address natural resource questions since 2004. We work with SCAT Departments of Forestry, Range Management and Environmental Protection. 

San Carlos River and Bylas Reach

FIGURE: A map showing the primary study site, including the San Carlos River and Bylas Reach of the Gila River from Petrakis et al. (2023[LN1] ).

FIGURE: A map showing the primary study site, including the San Carlos River and Bylas Reach of the Gila River from Petrakis et al. (2023[LN1] ).

Community members of the SCAT 1

Community members of the SCAT collecting tamarisk beetles on the Reservation (photo by Roy Petrakis, USGS) and USGS scientists teaching at the San Carlos Apache Tribe Summer Youth Practicum for Environmental Protection where the kids were talking about, learning about,  and building NIDS (photo by Christy Sangster Begay, SCAT). 

Community members of the SCAT collecting tamarisk beetles on the Reservation (photo by Roy Petrakis, USGS) and USGS scientists teaching at the San Carlos Apache Tribe Summer Youth Practicum for Environmental Protection where the kids were talking about, learning about,  and building NIDS (photo by Christy Sangster Begay, SCAT). 

An image telling everyone that the RUSH software is now available.
RUSH video thumbnail

RUSH is a tool for rapid repeat high resolution coastal vegetation maps to improve forecasting of hurricane impacts and coastal resilience.

RUSH is a tool for rapid repeat high resolution coastal vegetation maps to improve forecasting of hurricane impacts and coastal resilience.

Comparison images show versus high radiometric resolution
Aquatic Remote Sensing - Low versus high radiometric resolution

Low versus high radiometric resolution. Low resolution is low data storage, meaning only a few shades can be seen (as in the left image), high resolution is more data storage and means more shades can be recorded (right image).

Low versus high radiometric resolution. Low resolution is low data storage, meaning only a few shades can be seen (as in the left image), high resolution is more data storage and means more shades can be recorded (right image).

Image of two water glasses, with one glass full of clear water and the other with murky water
Aquatic remote sensing - image of water glasses

Two glasses of water, the one on the left has dissolved organics and particulate matter in it making it brown and cloudy. The glass on the right is clear and clean and colorless. This illustrates the main concept of aquatic remote sensing: water color changes based on what’s in it and we can link those color differences to differences in composition.

Two glasses of water, the one on the left has dissolved organics and particulate matter in it making it brown and cloudy. The glass on the right is clear and clean and colorless. This illustrates the main concept of aquatic remote sensing: water color changes based on what’s in it and we can link those color differences to differences in composition.

Chart showing example spectra of water, water with algae, and water with sediment
Aquatic Remote Sensing - Example spectra of water, water with algae, and water with sediment

Example spectra of water, water with algae, and water with sediment. The x-axis is wavelengths of light. For remote sensing of water, we are only interested in the visible range (400 nm – 700 nm) and a little bit of the ultra violet and infrared. The y-axis is the amount of light in each wavelength.

Example spectra of water, water with algae, and water with sediment. The x-axis is wavelengths of light. For remote sensing of water, we are only interested in the visible range (400 nm – 700 nm) and a little bit of the ultra violet and infrared. The y-axis is the amount of light in each wavelength.

Sequence of satellite images showing examples of low- and high-resolution imagery
Aquatic Remote Sensing - Examples of low- and high-resolution imagery

Examples of low- and high-resolution imagery. Higher resolution imagery allows more detailed spatial patterns to be viewed in the imagery. 

Chart showing examples of high and low temporal resolution
Aquatic Remote Sensing - Examples of high and low temporal resolution

Examples of high and low temporal resolution. A high-resolution sensor might image an area every day or two, whereas a low-resolution sensor might only image an area on the order of weeks.

Examples of high and low temporal resolution. A high-resolution sensor might image an area every day or two, whereas a low-resolution sensor might only image an area on the order of weeks.

Image of a cup of dark black coffee next to a cup of tea
Aquatic Remote Sensing - A cup of dark black coffee next to a cup of tea

This teacup has a moderate amount of dissolved organic material, which absorbs blue light but reflects some red and orange light. The coffee cup has a high amount of dissolved organic matter and appears almost black because of how much light it is absorbing.

This teacup has a moderate amount of dissolved organic material, which absorbs blue light but reflects some red and orange light. The coffee cup has a high amount of dissolved organic matter and appears almost black because of how much light it is absorbing.

Chart showing examples of spectral resolution
Aquatic Remote Sensing - Examples of spectral resolution

Examples of spectral resolution. High resolution sensors image many bands (i.e., colors) and lower resolution sensors image fewer bands. Higher spectral resolution lets us view more of the spectrum, but has cost, data storage, and band sensitivity trade-offs.

Examples of spectral resolution. High resolution sensors image many bands (i.e., colors) and lower resolution sensors image fewer bands. Higher spectral resolution lets us view more of the spectrum, but has cost, data storage, and band sensitivity trade-offs.

LGRIP30_V2_2 class map

The LP DAAC is pleased to announce the availability of five new Landsat-Derived Global Rainfed and Irrigated-Cropland Product at 30 meters (LGRIP30) Version 2 data products for the nominal year 2020. New Level 1 and Level 2 irrigation and rainfed data products subdivide their respective cropland types to provide greater detail in cropland spatial distribution.

The LP DAAC is pleased to announce the availability of five new Landsat-Derived Global Rainfed and Irrigated-Cropland Product at 30 meters (LGRIP30) Version 2 data products for the nominal year 2020. New Level 1 and Level 2 irrigation and rainfed data products subdivide their respective cropland types to provide greater detail in cropland spatial distribution.

LGRIP30 Version 2 Data

The LP DAAC is pleased to announce the availability of five new Landsat-Derived Global Rainfed and Irrigated-Cropland Product at 30 meters (LGRIP30) Version 2 data products for the nominal year 2020. New Level 1 and Level 2 irrigation and rainfed data products subdivide their respective cropland types to provide greater detail in cropland spatial distribution.

The LP DAAC is pleased to announce the availability of five new Landsat-Derived Global Rainfed and Irrigated-Cropland Product at 30 meters (LGRIP30) Version 2 data products for the nominal year 2020. New Level 1 and Level 2 irrigation and rainfed data products subdivide their respective cropland types to provide greater detail in cropland spatial distribution.

A photo of Dr Laura Norman giving an acceptance speech
Dr Laura Norman Accepting the 2024 Farouk El-Baz Award for Desert Research
A photo of the Farouk El-Baz Award given to Laura Norman
Farouk El-Baz Award presented to Laura Norman

A photo of the Farouk El-Baz Award for desert research that was present to Laura Norman.

A photo of Laura Norman
A photo of Dr Laura Norman

A photograph of Dr Laura Norman going up an escalator taken at the Farouk El-Baz award ceremony. 

A photograph of Dr Laura Norman going up an escalator taken at the Farouk El-Baz award ceremony. 

A graphic of the Young and Young-at-Heart Early-career focused group logo
Young and Young-at Heart logo

The logo of the Young and Young-at-Heart early-career focused group based at Moffett Field, CA.

The logo of the Young and Young-at-Heart early-career focused group based at Moffett Field, CA.

Was this page helpful?