PubTalk 2/2013 — Is "THE IMPOSSIBLE" Possible in the Pacific Northwest
PubTalk 2/2013 — Is "THE IMPOSSIBLE" Possible in the Pacific Northwest-- Coastal Community Tsunami Hazards and Risk
By Nathan Wood, Geographer

Official websites use .gov
A .gov website belongs to an official government organization in the United States.
Secure .gov websites use HTTPS
A lock () or https:// means you’ve safely connected to the .gov website. Share sensitive information only on official, secure websites.
The 2004 Indian Ocean, 2010 Chilean, and 2011 Tohoku disasters have shown how tsunamis are significant threats to coastal communities. To help U.S. coastal communities prepare for future tsunamis, the Hazards Vulnerability Team completed projects related to population exposure and sensitivity, pedestrian evacuation modeling, and vertical-evacuation decision support.
A recent article of ours in the Proceedings of the National Academy of Sciences captures many aspects of our tsunami-related research. Focusing on tsunamis associated with a Cascadia subduction zone earthquake in the U.S. Pacific Northwest, the article integrates GIS methods to identify the number and characteristics of people in hazard zones, evacuation modeling to estimate travel times to safety, and cluster analysis to classify communities with similar vulnerability. Results can be used to enhance general tsunami-awareness efforts with targeted interventions, such as education and outreach tailored to local demographics, evacuation training, and/or vertical evacuation refuges.
How many people live and work in tsunami-zones in my community?

Will people have enough time to evacuate before tsunami waves arrive?

In collaboration with the State of Washington Emergency Management Division and Sacramento State University, we integrated evacuation modeling and results of community workshops to develop a framework for deciding how to compare vertical-evacuation refuge options. As a case study, we demonstrate this decision support for the coastal community of Ocean Shores, Washington, which is threatened by local tsunamis associated with Cascadia subduction zone earthquakes.

How can GIS be used to map hot-spots of community exposure to tsunami hazards?

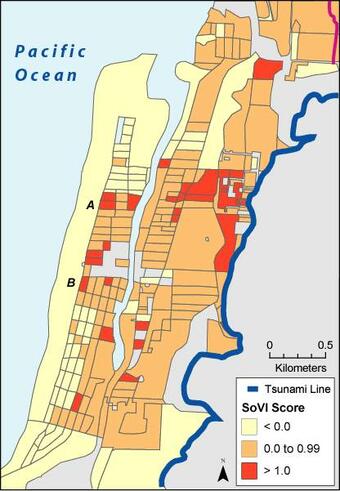
In collaboration with the University of South Carolina, we combined geospatial tools with statistical factor analysis to understand and map hot-spots of demographic sensitivity to Cascadia tsunamis along the Oregon coast. This information can be used to develop targeted outreach and preparedness training that address local needs.

How do people perceive the risks posed by tsunami hazards along the Pacific Northwest coast?
Below are multimedia items associated with this project.

-- Coastal Community Tsunami Hazards and Risk
By Nathan Wood, Geographer
-- Coastal Community Tsunami Hazards and Risk
By Nathan Wood, Geographer
The 2004 Indian Ocean, 2010 Chilean, and 2011 Tohoku disasters have shown how tsunamis are significant threats to coastal communities. To help U.S. coastal communities prepare for future tsunamis, the Hazards Vulnerability Team completed projects related to population exposure and sensitivity, pedestrian evacuation modeling, and vertical-evacuation decision support.
A recent article of ours in the Proceedings of the National Academy of Sciences captures many aspects of our tsunami-related research. Focusing on tsunamis associated with a Cascadia subduction zone earthquake in the U.S. Pacific Northwest, the article integrates GIS methods to identify the number and characteristics of people in hazard zones, evacuation modeling to estimate travel times to safety, and cluster analysis to classify communities with similar vulnerability. Results can be used to enhance general tsunami-awareness efforts with targeted interventions, such as education and outreach tailored to local demographics, evacuation training, and/or vertical evacuation refuges.
How many people live and work in tsunami-zones in my community?
Will people have enough time to evacuate before tsunami waves arrive?
In collaboration with the State of Washington Emergency Management Division and Sacramento State University, we integrated evacuation modeling and results of community workshops to develop a framework for deciding how to compare vertical-evacuation refuge options. As a case study, we demonstrate this decision support for the coastal community of Ocean Shores, Washington, which is threatened by local tsunamis associated with Cascadia subduction zone earthquakes.
How can GIS be used to map hot-spots of community exposure to tsunami hazards?
In collaboration with the University of South Carolina, we combined geospatial tools with statistical factor analysis to understand and map hot-spots of demographic sensitivity to Cascadia tsunamis along the Oregon coast. This information can be used to develop targeted outreach and preparedness training that address local needs.
How do people perceive the risks posed by tsunami hazards along the Pacific Northwest coast?
Below are multimedia items associated with this project.
-- Coastal Community Tsunami Hazards and Risk
By Nathan Wood, Geographer
-- Coastal Community Tsunami Hazards and Risk
By Nathan Wood, Geographer