
USGS scientists collect core samples from marsh to explore the drives of wetland accretion in the face of rising seas and human impacts impact the evolution on salt marshes.
Images
Woods Hole Coastal and Marine Science Center images
Filter Total Items: 1298

Coring in the Marsh
USGS scientists collect core samples from marsh to explore the drives of wetland accretion in the face of rising seas and human impacts impact the evolution on salt marshes.
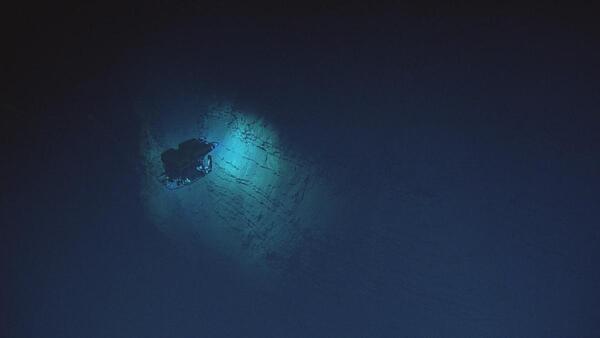
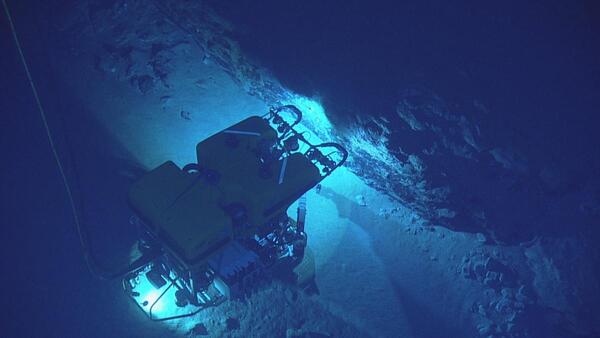
Mona Rift Seafloor
Nautilus dive on the Mona Rift western slope, off the coast of Puerto Rico.
Nautilus dive on the Mona Rift western slope, off the coast of Puerto Rico.
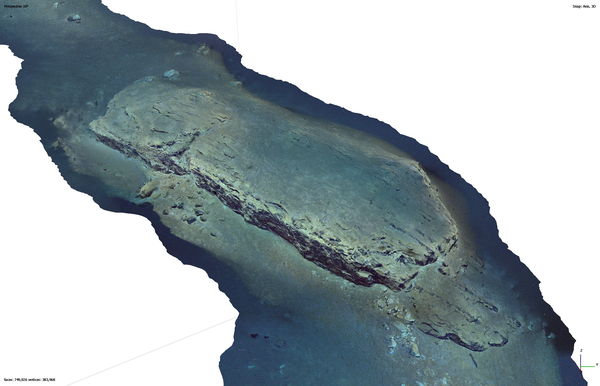
3D Mona Rift Model
A recent study from the U.S. Geological Survey offers a workflow for generating virtual maps of the deep seafloor from archived exploration dives. This work can help advance exploration of the deep-sea frontier and extends into other fields.
A recent study from the U.S. Geological Survey offers a workflow for generating virtual maps of the deep seafloor from archived exploration dives. This work can help advance exploration of the deep-sea frontier and extends into other fields.

Blake DVI test track
Test track from 1970’s commercial dredging equipment trials through a nodule field on the Blake Plateau, imaged in 2022 from an autonomous underwater vehicle (BOEM/USGS).
Test track from 1970’s commercial dredging equipment trials through a nodule field on the Blake Plateau, imaged in 2022 from an autonomous underwater vehicle (BOEM/USGS).

Group Photo
USGS scientists working on FLACC study coastal change, and develop techniques and metrics to measure past, present, and future shoreline change rates along the sandy coasts of the U.S.
USGS scientists working on FLACC study coastal change, and develop techniques and metrics to measure past, present, and future shoreline change rates along the sandy coasts of the U.S.

ROV and Mona Rift dive site
(Top): Map of dives labeled and shown in red and orange located near the Mona Rift, northwest of Puerto Rico. Contours show depths in meters at 500 m intervals. Square indicates location of dive. Bathymetry from Andrews et al. Yellow curve denotes landslide tsunami source of Lopéz-Venegas et al.
(Top): Map of dives labeled and shown in red and orange located near the Mona Rift, northwest of Puerto Rico. Contours show depths in meters at 500 m intervals. Square indicates location of dive. Bathymetry from Andrews et al. Yellow curve denotes landslide tsunami source of Lopéz-Venegas et al.

Collecting Observational Data
Observational data are key to identify landscape change tipping points and the role of invasive species on coastal change. Photo of USGS staff mapping invasive Phragmites on Assateague Island National Seashore. Photo by Seth Ackerman.
Observational data are key to identify landscape change tipping points and the role of invasive species on coastal change. Photo of USGS staff mapping invasive Phragmites on Assateague Island National Seashore. Photo by Seth Ackerman.

Marsh in Wellfleet, MA
USGS scientists collect core samples from marsh to explore the drives of wetland accretion in the face of rising seas and human impacts impact the evolution on salt marshes.
USGS scientists collect core samples from marsh to explore the drives of wetland accretion in the face of rising seas and human impacts impact the evolution on salt marshes.
Mona Rift Seafloor
Nautilus dive on the Mona Rift western slope, off the coast of Puerto Rico.
Nautilus dive on the Mona Rift western slope, off the coast of Puerto Rico.

Adrian Mann at the Massachusetts Maritime Academy pool during "Working over water" training
Adrian Mann at the Massachusetts Maritime Academy pool during "Working over water" trainingAdrian Mann (Woods Hole Coastal and Marine Science Center Lab Manager and Safety Officer) at the Massachusetts Maritime Academy pool during "Working over water" training.
Winter 2023 Photo Contest Winner: Chris Sherwood, People category

Nantucket Sound Bathymetry
In collaboration with Massachusetts Coastal Zone Management Agency (MCZM), SFMG completed a geophysical survey (multibeam echosounder and chirp seismic survey) within Nantucket Sound to characterize the seafloor surface and subsurface. The effort extended coverage in Nantucket Sound along the southern shore of Upper Cape Co
In collaboration with Massachusetts Coastal Zone Management Agency (MCZM), SFMG completed a geophysical survey (multibeam echosounder and chirp seismic survey) within Nantucket Sound to characterize the seafloor surface and subsurface. The effort extended coverage in Nantucket Sound along the southern shore of Upper Cape Co

Belfast Seafloor
Bathymetry of the Belfast Bay, ME pockmark field.
Bathymetry of the Belfast Bay, ME pockmark field.

Ox Bel Ha Infographic - English Version
Infographic showing how stormwater provides underwater caves with an influx of oxygen that is critical to supporting microorganisms—an integral part of the food web—and limiting the release of harmful greenhouse gases into the ocean and atmosphere.
Infographic showing how stormwater provides underwater caves with an influx of oxygen that is critical to supporting microorganisms—an integral part of the food web—and limiting the release of harmful greenhouse gases into the ocean and atmosphere.

Ox Bel Ha Infographic - Spanish version
Infographic showing how stormwater provides underwater caves with an influx of oxygen that is critical to supporting microorganisms—an integral part of the food web—and limiting the release of harmful greenhouse gases into the ocean and atmosphere.
Infographic showing how stormwater provides underwater caves with an influx of oxygen that is critical to supporting microorganisms—an integral part of the food web—and limiting the release of harmful greenhouse gases into the ocean and atmosphere.

An animation showing tectonic faults across the Eastern Pacific Ocean from space, including the Queen Charlotte-Fairweather fault
An animation showing tectonic faults across the Eastern Pacific Ocean from space, including the Queen Charlotte-Fairweather faultAn animation showing tectonic faults across the Eastern Pacific Ocean from space. The San Andreas fault in California is shown in green, and the Cascadia Subduction Zone north of it is shown in yellow. The animation ends at the location of Queen Charlotte-Fairweather fault (in yellow), displaying the latest 30-meter terrain model.

A computed-generated image showing the Queen Charlotte Fault and nearshore area, using bathymetry and lidar data
A computed-generated image showing the Queen Charlotte Fault and nearshore area, using bathymetry and lidar dataA computed-generated image showing the bathymetry of the Queen Charlotte Fault and the elevation of mountains in the nearshore area, using bathymetry and lidar data.

Map of U.S. Coastlines
Our Nation’s coastlines are almost 100,000 miles long. These extensive coastal areas stretch from Maine’s Atlantic shores in the northeast, south along the shores of the Gulf of America and insular areas in the Caribbean.
Our Nation’s coastlines are almost 100,000 miles long. These extensive coastal areas stretch from Maine’s Atlantic shores in the northeast, south along the shores of the Gulf of America and insular areas in the Caribbean.

sUAS Lidar Training
The USGS Woods Hole Coastal and Marine Science Center Aerial Imaging and Mapping group hosted a training workshop on using small uncrewed aircraft system (sUAS) lidar technology. The workshop was taught by Mark Bauer and Matt Burgess of the USGS National Uncrewed Systems Office and Geoffrey DeBenedetto of the USGS Arizona Water Science Center.
The USGS Woods Hole Coastal and Marine Science Center Aerial Imaging and Mapping group hosted a training workshop on using small uncrewed aircraft system (sUAS) lidar technology. The workshop was taught by Mark Bauer and Matt Burgess of the USGS National Uncrewed Systems Office and Geoffrey DeBenedetto of the USGS Arizona Water Science Center.

sUAS Lidar Training
Xandra Evans (USGS Woods Hole Coastal and Marine Science Center) next to a ground control target at Great Sippewisset Marsh in Falmouth, Massachusetts as part of a multiday, small uncrewed aerial system (sUAS) lidar training.
Xandra Evans (USGS Woods Hole Coastal and Marine Science Center) next to a ground control target at Great Sippewisset Marsh in Falmouth, Massachusetts as part of a multiday, small uncrewed aerial system (sUAS) lidar training.

sUAS Lidar Training
Matt Burgess (USGS National Uncrewed Systems Office) and Seth Ackerman (USGS Woods Hole Coastal and Marine Science Center) prepare the uncrewed aircraft system (UAS) to collect lidar data at Great Sippewisset Marsh in Falmouth, Massachusetts as part of a multiday small UAS lidar training.
Matt Burgess (USGS National Uncrewed Systems Office) and Seth Ackerman (USGS Woods Hole Coastal and Marine Science Center) prepare the uncrewed aircraft system (UAS) to collect lidar data at Great Sippewisset Marsh in Falmouth, Massachusetts as part of a multiday small UAS lidar training.

sUAS Lidar Training
Collecting lidar data at Great Sippewissett Marsh in Falmouth, Massachusetts as part of a multiday, small uncrewed aircraft system (sUAS) lidar training.
Collecting lidar data at Great Sippewissett Marsh in Falmouth, Massachusetts as part of a multiday, small uncrewed aircraft system (sUAS) lidar training.