
Coastal Change Likelihood Assessment—Predicting Coastal Landscape Change with Accuracy
In a recently published study, USGS scientists assess the accuracy of the Coastal Change Likelihood assessment. Results demonstrate the assessment provides accurate estimates of coastal landscape change in the next decade, consistent with recent observed change.
Coastal landscape change, whether caused by extreme storms, erosion, or changing sea levels, can threaten lives and livelihoods, important infrastructure, and valuable resources along the coast. To safeguard our Nation’s coastal communities and assets, land-use planners and coastal managers rely on decision-support products to predict hazard impacts and subsequent coastal change. The question is, how confident can they be in those predictions?
A study recently published in the Journal of Coastal Research introduces the Coastal Change Likelihood assessment, developed by the USGS to estimate the likelihood of coastal landscape change over the next decade for the northeastern U.S. coastline (from Maine to Virginia). In this study, the researchers conducted a series of statistical tests to evaluate the quality of the data and the performance of the model:
The foundational land cover dataset used in the model achieved 94% overall accuracy, with a high agreement between mapped features and expert interpretation.
The supervised machine learning classification that powers Coastal Change Likelihood predictions reached 92% accuracy.
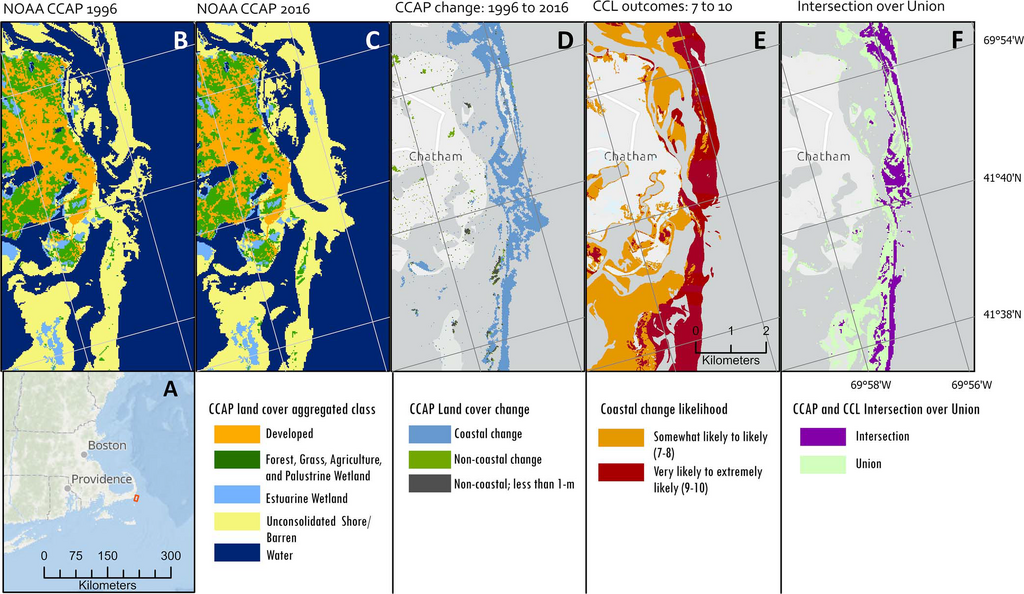
When compared to observed coastal land cover changes over the past 20 years, Coastal Change Likelihood predictions aligned with 95% of the areas that actually changed, demonstrating the model’s ability to reflect real-world dynamics and the recurring nature of coastal change.
These results establish the Coastal Change Likelihood assessment as a trustworthy decision-support product that can help coastal planners and managers make informed choices.
Read the journal article to learn more:
Pendleton, E.A., Lentz, E.E., Henderson, R.E., Heslin, J.L., Bartlett, M.K., and Sterne, T.K., 2025, Assessing Decadal-Scale Coastal change Likelihood to Define the Accuracy and Application of Scientific Information: Journal of Coastal Research, Volume 41, Issue 5, https://doi.org/10.2112/JCOASTRES-D-24-00072.1.
A Trustworthy Tool for Smarter Planning
The Coastal Change Likelihood assessment provides high-resolution maps (10 meters per pixel) that highlight areas most likely to experience change due to hazards like storms, sea level change, erosion, and tidal flooding.

Currently, data are available for the Northeast region of the U.S., from Maine to Virginia, and extend across the coastal zone. The USGS is committed to bringing the assessment to the shores of the Southeast U.S. and the Great Lakes through collaborations with the Department of Defense and the Great Lakes Restoration Initiative, respectively.
While no model can predict the future with perfect certainty, the Coastal Change Likelihood assessment is a proven resource in the face of growing coastal change challenges.


Related

Coastal Change Likelihood
Related