USGS water expert measures floodwaters in Barbourville, KY
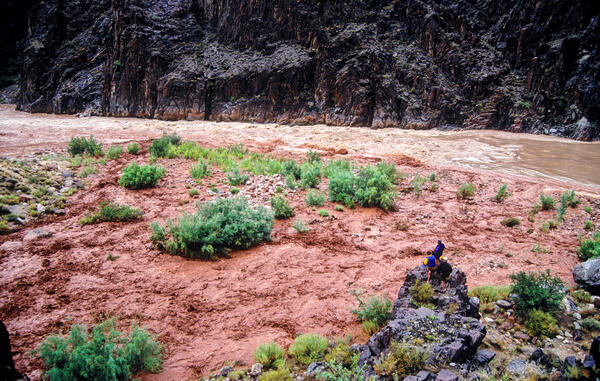
USGS water expert measures floodwaters in Barbourville, KYUSGS water expert Conner Langley measures flood water speed and height at Cumberland River in Barbourville, KY on February 17. He holds a radio in his left hand to stay in contact with colleagues for safety and to relay water flow measurements. This Cumberland River streamgage is funded by the U.S.