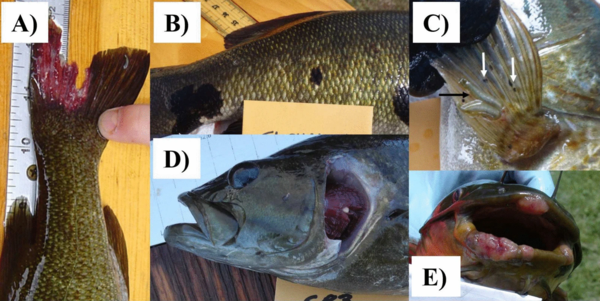
U.S. flag

An official website of the United States government

Multimedia

USGS translates our science from reports and journal articles, and engages stakeholders, to inform restoration and conservation decisions across the Chesapeake watershed. Multimedia information includes geologic maps, and from publications, videos, and Geonarratives that provide stories and maps about selected findings.

Images

View of the Susquehanna River from just above water level, with trees covering both banks.
The Susquehanna River

View of the Susquehanna River, the longest river on the east coast of the United States.

View of the Susquehanna River, the longest river on the east coast of the United States.

Two maps of Chesapeake Bay watershed and line graph below maps. Left: Predicted median annual SC. Right: SC departure class.
Diagram showing predicted median annual specific conductance (SC) for all modeled stream reaches in the Chesapeake Bay watershed

(a) Predicted median annual specific conductance (SC) for all modeled stream reaches in the Chesapeake Bay watershed (CBW) for the 2014–2016 time period. (b) SC departure classes for the 2014–2016 time period. (c) Percent of the modeled CBW area in each of the departure classes over the four time periods.

(a) Predicted median annual specific conductance (SC) for all modeled stream reaches in the Chesapeake Bay watershed (CBW) for the 2014–2016 time period. (b) SC departure classes for the 2014–2016 time period. (c) Percent of the modeled CBW area in each of the departure classes over the four time periods.

Two researchers in life vests stand at a table full of water quality sampling equipment. They demonstrate its use.
Water Quality Sampling Equipment Show-and-Tell

USGS scientists Jimmy Webber and Dan Burns explain how water quality equipment is used to take measurements at War Branch and other monitoring stations.

USGS scientists Jimmy Webber and Dan Burns explain how water quality equipment is used to take measurements at War Branch and other monitoring stations.

Community members gather at an outreach table, reading USGS fact sheets
Outreach Event at War Branch

The USGS and local partners hosted a meeting at the War Branch monitoring station to share water-quality and conservation work happening in the watershed with farmers, environmental and agricultural agencies, nonprofit groups, and local universities.

The USGS and local partners hosted a meeting at the War Branch monitoring station to share water-quality and conservation work happening in the watershed with farmers, environmental and agricultural agencies, nonprofit groups, and local universities.

15 people stand next to a bioreactor, a dam in a spring-fed creek made up of woodchips, soil, and straw.
Visit to the War Branch Bioreactor

Community partners tour the bioreactor at War Branch. 

The War Branch bioreactor was installed below a natural spring in the War Branch watershed. The USGS had previously measured elevated nitrate concentrations from this spring. 

Community partners tour the bioreactor at War Branch. 

The War Branch bioreactor was installed below a natural spring in the War Branch watershed. The USGS had previously measured elevated nitrate concentrations from this spring. 

13 people stand next to the outlet of a bioreactor, which is a rock wall with a white pipe emerging, discharging water.
A Visit to the War Branch Bioreactor

Community partners tour the bioreactor at War Branch. 

The War Branch bioreactor was installed below a natural spring in the War Branch watershed. The USGS had previously measured elevated nitrate concentrations from this spring. 

Community partners tour the bioreactor at War Branch. 

The War Branch bioreactor was installed below a natural spring in the War Branch watershed. The USGS had previously measured elevated nitrate concentrations from this spring. 

Videos

Screenshot image showing title of video, USGS identifier, and photo of broad river with shoreline and sky Susquehanna River Story — What does the science say about water quality?
Susquehanna River Story — What does the science say about water quality?

Narrated presentation that provides a unique synthesis of the story of nutrient water quality in the Susquehanna watershed.

Narrated presentation that provides a unique synthesis of the story of nutrient water quality in the Susquehanna watershed.

Close up of running water with the text, "Soaking Up Stormwater". Soaking Up Stormwater (AD)
Soaking Up Stormwater (AD)

This video acts as a “visual abstract” for a recent publication analyzing the stormwater management practices in Clarksburg, MD. The video features interviews with the team of USGS scientists as well as a water specialist from Montgomery County.

This video acts as a “visual abstract” for a recent publication analyzing the stormwater management practices in Clarksburg, MD. The video features interviews with the team of USGS scientists as well as a water specialist from Montgomery County.

Close up of running water with the text, "Soaking Up Stormwater". Soaking Up Stormwater
Soaking Up Stormwater

This video acts as a “visual abstract” for a recent publication analyzing the stormwater management practices in Clarksburg, MD. The video features interviews with the team of USGS scientists as well as a water specialist from Montgomery County.

This video acts as a “visual abstract” for a recent publication analyzing the stormwater management practices in Clarksburg, MD. The video features interviews with the team of USGS scientists as well as a water specialist from Montgomery County.

A photo of a scientist collecting a water sample behind the words 'Chesapeake Bay Status and Trends' Chesapeake Bay Status and Trends (AD)
Chesapeake Bay Status and Trends (AD)

The Chesapeake Bay is one of the Nation's largest ecosystem restoration efforts, so monitoring to assess changes in condition is crucial. The USGS is monitoring the status and trends of key indicators for the health of streams and rivers in the Chesapeake Bay watershed.

The Chesapeake Bay is one of the Nation's largest ecosystem restoration efforts, so monitoring to assess changes in condition is crucial. The USGS is monitoring the status and trends of key indicators for the health of streams and rivers in the Chesapeake Bay watershed.

A photo of a scientist collecting a water sample behind the words 'Chesapeake Bay Status and Trends' Chesapeake Bay Status and Trends
Chesapeake Bay Status and Trends

The Chesapeake Bay is one of the Nation's largest ecosystem restoration efforts, so monitoring to assess changes in condition is crucial. The USGS is monitoring the status and trends of key indicators for the health of streams and rivers in the Chesapeake Bay watershed.

The Chesapeake Bay is one of the Nation's largest ecosystem restoration efforts, so monitoring to assess changes in condition is crucial. The USGS is monitoring the status and trends of key indicators for the health of streams and rivers in the Chesapeake Bay watershed.

USGS symbol and title text on image of coastal forest landscape and bay Nitrogen in the Chesapeake Bay Watershed: A Century of Change
Nitrogen in the Chesapeake Bay Watershed: A Century of Change

Narrated presentation that provides a unique, long-term perspective (1950-2050) of the major drivers of nitrogen change up to the present, and forecasts how they may affect nitrogen into the future for the Chesapeake Bay watershed. Information is based off of U.S. Geological Survey Circular 1486.

Narrated presentation that provides a unique, long-term perspective (1950-2050) of the major drivers of nitrogen change up to the present, and forecasts how they may affect nitrogen into the future for the Chesapeake Bay watershed. Information is based off of U.S. Geological Survey Circular 1486.

Was this page helpful?