
EFFECTS: Exploring Flora, Fauna, Environments, and Climates Through Simulations
“Studying past vegetation changes can help inform conservation and natural resource management activities.”
This research uses state-of-the-art vegetation models to simulate vegetation changes across paleo (e.g., 127 ka; 127,000 years ago) to modern (e.g., 21st-century) time periods. We investigate the magnitude, rate, and drivers of vegetation change (e.g., wildfire, drought), with a focus on forest-to-grassland or shrubland and boreal forest-to-tundra transitions in North America. Results of this research will be used to inform conservation and natural resource planning efforts for managing species and habitats of management concern.
Simulated Vegetation Changes
We use paleoclimate simulations with vegetation models to simulate past vegetation changes and compare the results with paleoclimate- and paleovegetation-related data from ice sheets, lake and ocean sediments, tree rings, and a range of other sources.
The term “paleo” comes from the Greek word “palaios”, which means ancient.
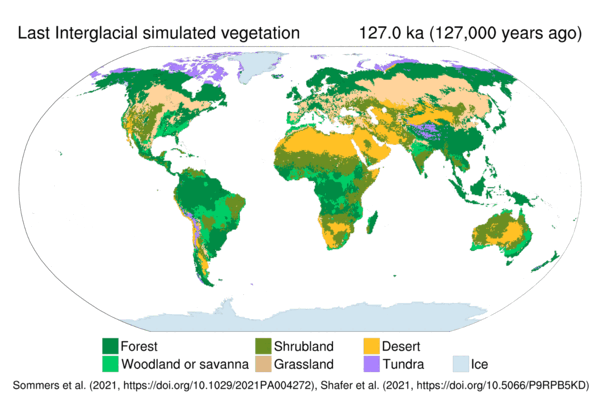
Our research collaborations with partners at the NSF National Center for Atmospheric Research (NCAR), the University of Oregon, and elsewhere have shown that vegetation changes over large areas during the Last Interglacial period (~127,000 years ago; animated image, right) may have affected Greenland Ice Sheet melting and subsequent sea level rise (Sommers et al. 2021, Shafer et al. 2020).
Regions of Interest
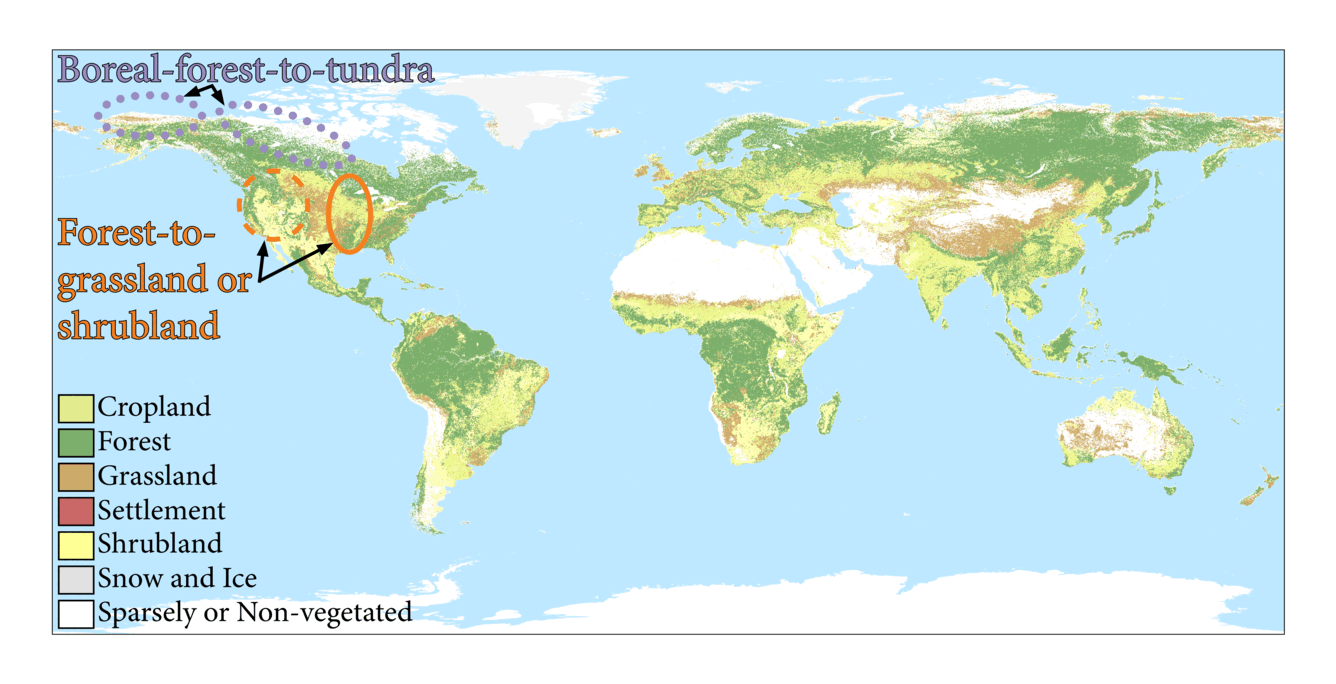
Changes in the distributions of forest versus non-forest (i.e., grassland, shrubland, tundra) vegetation are particularly important. Our research focuses on changes at forest-to-non-forest transitions, including high latitude boreal-forest-to-tundra (purple ovals) and mid-latitude forest-to-grassland (orange ovals) regions.
Vegetation Effects on Climate
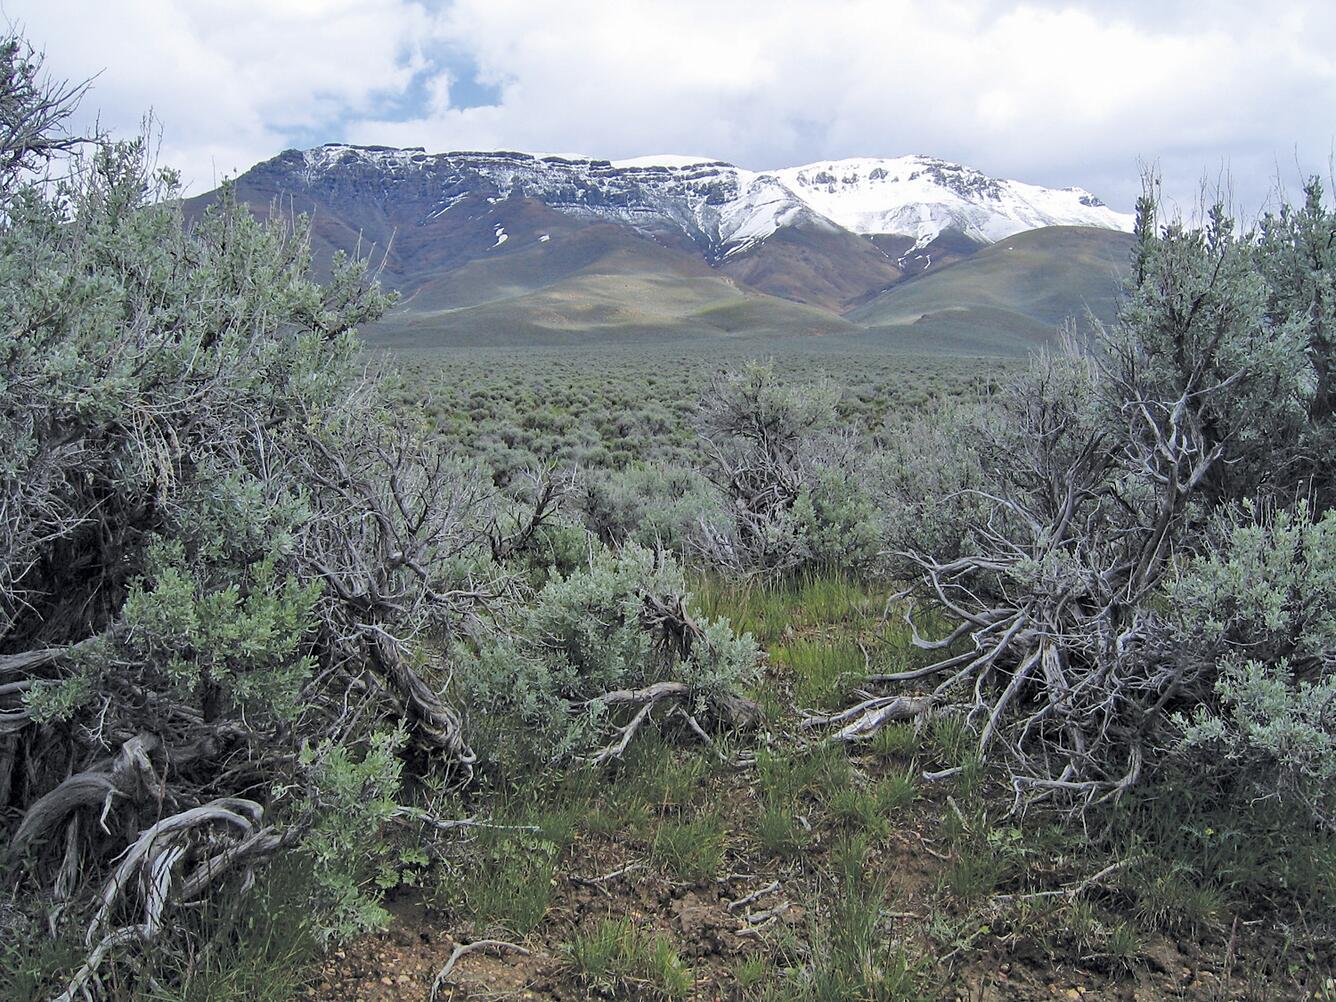
Vegetation changes may affect climate by altering land cover. Forest vegetation may be darker (i.e., have a lower albedo) than grassland, shrubland, or tundra vegetation, such as shown in this image of tundra and forest (right). The lower albedo of forest vegetation may lead to warmer air temperatures near the surface at certain times of the year (Bartlein et al. 2015).

Complex Changes in Mountain Regions
In mountain regions, such as the western United States, there may be both low elevation and high elevation boundaries between forest and grassland, shrubland, or tundra vegetation. At lower elevations in drier regions, grasslands and shrublands may be present. These vegetation types may be replaced by forest at higher elevations where more moisture is available to support tree growth. At even higher elevations, forest may transition to alpine tundra.
Conservation and Natural Resource Management
Conservation and natural resource managers are interested in understanding potential changes in the distribution of forest, grassland, shrubland, and tundra vegetation, and the ways in which these changes may impact species and habitats of management concern.
Our research develops analyses and variables that can be used for conservation and natural resource management planning efforts.
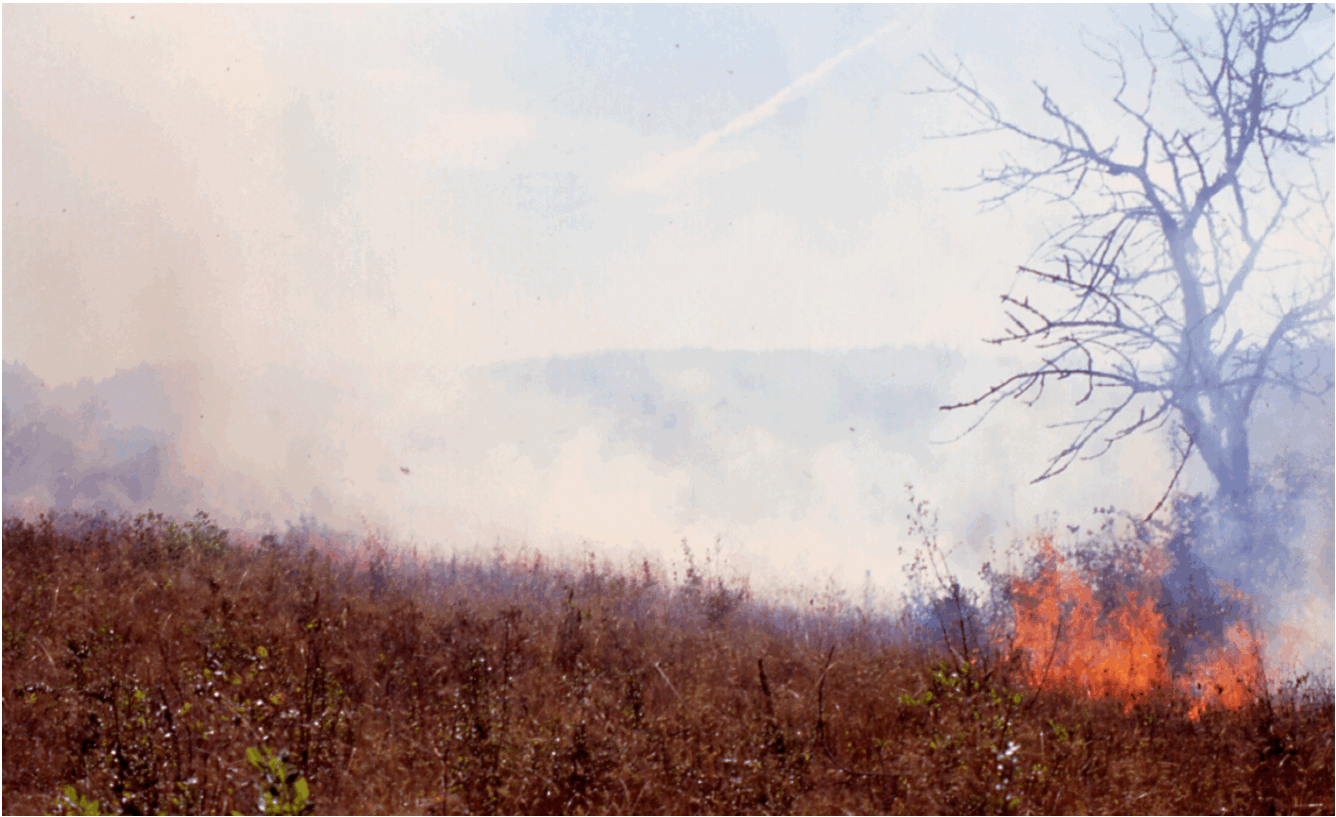
Photo: Controlled burn in the southern Willamette Valley (Oregon, USA).
Methods
This research uses vegetation models, including the equilibrium vegetation model BIOME4 (Kaplan et al. 2003) and the ecosystem model LPJ-GUESS (Smith et al. 2014), to simulate vegetation. BIOME4 and LPJ-GUESS are numerical models that simulate the ecological, physiological, and environmental processes governing plant distribution and growth. Vegetation is simulated in terms of plant functional types (e.g., needleleaf evergreen trees, C3 grasses) and biomes (e.g., temperate evergreen needleleaf forest, temperate grassland).
The climate data we use as input for the vegetation models come from recent state-of-the-art climate simulations, such as those from the Coupled Model Intercomparison Project phase 6 (CMIP6) and the Paleoclimate Modelling Intercomparison Project phase 4 (PMIP4). We typically bias correct and downscale the climate data onto global and regional grids. Data for paleo time periods are month-length adjusted as needed (Bartlein and Shafer, 2019). Additional input data include soil variables and atmospheric carbon dioxide concentration.
Acknowledgements
References
Bartlein, P.J., Edwards, M.E., Hostetler, S.W., Shafer, S.L., Anderson, P.M., Brubaker, L.B., and Lozhkin, A.V., 2015, Early-Holocene warming in Beringia and its mediation by sea-level and vegetation changes: Climate of the Past 11:1197-1222, https://doi.org/10.5194/cp-11-1197-2015.
Bartlein, P.J., and Shafer, S.L., 2019, Paleo calendar-effect adjustments in time-slice and transient climate-model simulations (PaleoCalAdjust v1.0): impact and strategies for data analysis. Paleoclimate Modelling Intercomparison Project (PMIP4) Special Issue: Geoscientific Model Development 12:3889-3913, https://doi.org/10.5194/gmd-12-3889-2019.
Kaplan, J.O., Bigelow, N.H., Prentice, I.C., Harrison, S.P., Bartlein, P.J., Christensen, T.R., Cramer, W., Matveyeva, N.V., McGuire, A.D., Murray, D.F., Razzhivin, V.Y., Smith, B., Walker, D.A., Anderson, P.M., Andreev, A.A., Brubaker, L.B., Edwards, M.E., and Lozhkin, A.V., 2003, Climate change and Arctic ecosystems: 2. Modeling, paleodata-model comparisons, and future projections: Journal of Geophysical Research 108(D19), 8171, https://doi.org/10.1029/2002JD002559.
Sayre, R., 2022, World Terrestrial Ecosystems (WTE) 2020: U.S. Geological Survey data release, https://doi.org/10.5066/P9DO61LP.
Shafer, S.L., Bartlein, P.J., Sommers, A.N., Otto-Bliesner, B.L., Lipscomb, W.H., Lofverstrom, M., Brady, E.C., Kluzek, E., Leguy, G., Thayer-Calder, K., and Tomas, R.A., 2021, Global biomes for the Last Interglacial period (127-119 ka) simulated by BIOME4 using CESM2-CISM2 coupled climate–ice sheet model data: U.S. Geological Survey data release, https://doi.org/10.5066/P9RPB5KD.
Smith, B., Wårlind, D., Arneth, A., Hickler, T., Leadley, P., Siltberg, J., and Zaehle, S., 2014, Implications of incorporating N cycling and N limitations on primary production in an individual-based dynamic vegetation model: Biogeosciences 11:2027–2054, https://doi.org/10.5194/bg-11-2027-2014.
Sommers, A.N., Otto-Bliesner, B.L., Lipscomb, W.H., Lofverstrom, M., Shafer, S.L., Bartlein, P.J., Brady, E.C., Kluzek, E., Leguy, G., Thayer-Calder, K., Tomas, R.A., 2021, Retreat and regrowth of the Greenland Ice Sheet during the Last Interglacial as simulated by the CESM2-CISM2 coupled climate–ice sheet model. Community Earth System Model version 2 (CESM2) Special Collection: Paleoceanography and Paleoclimatology 36:e2021PA004272, https://doi.org/10.1029/2021PA004272.
This research uses state-of-the-art vegetation models to simulate vegetation changes across paleo (e.g., 127 ka; 127,000 years ago) to modern (e.g., 21st-century) time periods. We investigate the magnitude, rate, and drivers of vegetation change (e.g., wildfire, drought), with a focus on forest-to-grassland or shrubland and boreal forest-to-tundra transitions in North America. Results of this research will be used to inform conservation and natural resource planning efforts for managing species and habitats of management concern.
Simulated Vegetation Changes
We use paleoclimate simulations with vegetation models to simulate past vegetation changes and compare the results with paleoclimate- and paleovegetation-related data from ice sheets, lake and ocean sediments, tree rings, and a range of other sources.
The term “paleo” comes from the Greek word “palaios”, which means ancient.
Our research collaborations with partners at the NSF National Center for Atmospheric Research (NCAR), the University of Oregon, and elsewhere have shown that vegetation changes over large areas during the Last Interglacial period (~127,000 years ago; animated image, right) may have affected Greenland Ice Sheet melting and subsequent sea level rise (Sommers et al. 2021, Shafer et al. 2020).
Regions of Interest
Changes in the distributions of forest versus non-forest (i.e., grassland, shrubland, tundra) vegetation are particularly important. Our research focuses on changes at forest-to-non-forest transitions, including high latitude boreal-forest-to-tundra (purple ovals) and mid-latitude forest-to-grassland (orange ovals) regions.
Vegetation Effects on Climate
Vegetation changes may affect climate by altering land cover. Forest vegetation may be darker (i.e., have a lower albedo) than grassland, shrubland, or tundra vegetation, such as shown in this image of tundra and forest (right). The lower albedo of forest vegetation may lead to warmer air temperatures near the surface at certain times of the year (Bartlein et al. 2015).
Complex Changes in Mountain Regions
In mountain regions, such as the western United States, there may be both low elevation and high elevation boundaries between forest and grassland, shrubland, or tundra vegetation. At lower elevations in drier regions, grasslands and shrublands may be present. These vegetation types may be replaced by forest at higher elevations where more moisture is available to support tree growth. At even higher elevations, forest may transition to alpine tundra.
Conservation and Natural Resource Management
Conservation and natural resource managers are interested in understanding potential changes in the distribution of forest, grassland, shrubland, and tundra vegetation, and the ways in which these changes may impact species and habitats of management concern.
Our research develops analyses and variables that can be used for conservation and natural resource management planning efforts.
Photo: Controlled burn in the southern Willamette Valley (Oregon, USA).
Methods
This research uses vegetation models, including the equilibrium vegetation model BIOME4 (Kaplan et al. 2003) and the ecosystem model LPJ-GUESS (Smith et al. 2014), to simulate vegetation. BIOME4 and LPJ-GUESS are numerical models that simulate the ecological, physiological, and environmental processes governing plant distribution and growth. Vegetation is simulated in terms of plant functional types (e.g., needleleaf evergreen trees, C3 grasses) and biomes (e.g., temperate evergreen needleleaf forest, temperate grassland).
The climate data we use as input for the vegetation models come from recent state-of-the-art climate simulations, such as those from the Coupled Model Intercomparison Project phase 6 (CMIP6) and the Paleoclimate Modelling Intercomparison Project phase 4 (PMIP4). We typically bias correct and downscale the climate data onto global and regional grids. Data for paleo time periods are month-length adjusted as needed (Bartlein and Shafer, 2019). Additional input data include soil variables and atmospheric carbon dioxide concentration.
Acknowledgements
References
Bartlein, P.J., Edwards, M.E., Hostetler, S.W., Shafer, S.L., Anderson, P.M., Brubaker, L.B., and Lozhkin, A.V., 2015, Early-Holocene warming in Beringia and its mediation by sea-level and vegetation changes: Climate of the Past 11:1197-1222, https://doi.org/10.5194/cp-11-1197-2015.
Bartlein, P.J., and Shafer, S.L., 2019, Paleo calendar-effect adjustments in time-slice and transient climate-model simulations (PaleoCalAdjust v1.0): impact and strategies for data analysis. Paleoclimate Modelling Intercomparison Project (PMIP4) Special Issue: Geoscientific Model Development 12:3889-3913, https://doi.org/10.5194/gmd-12-3889-2019.
Kaplan, J.O., Bigelow, N.H., Prentice, I.C., Harrison, S.P., Bartlein, P.J., Christensen, T.R., Cramer, W., Matveyeva, N.V., McGuire, A.D., Murray, D.F., Razzhivin, V.Y., Smith, B., Walker, D.A., Anderson, P.M., Andreev, A.A., Brubaker, L.B., Edwards, M.E., and Lozhkin, A.V., 2003, Climate change and Arctic ecosystems: 2. Modeling, paleodata-model comparisons, and future projections: Journal of Geophysical Research 108(D19), 8171, https://doi.org/10.1029/2002JD002559.
Sayre, R., 2022, World Terrestrial Ecosystems (WTE) 2020: U.S. Geological Survey data release, https://doi.org/10.5066/P9DO61LP.
Shafer, S.L., Bartlein, P.J., Sommers, A.N., Otto-Bliesner, B.L., Lipscomb, W.H., Lofverstrom, M., Brady, E.C., Kluzek, E., Leguy, G., Thayer-Calder, K., and Tomas, R.A., 2021, Global biomes for the Last Interglacial period (127-119 ka) simulated by BIOME4 using CESM2-CISM2 coupled climate–ice sheet model data: U.S. Geological Survey data release, https://doi.org/10.5066/P9RPB5KD.
Smith, B., Wårlind, D., Arneth, A., Hickler, T., Leadley, P., Siltberg, J., and Zaehle, S., 2014, Implications of incorporating N cycling and N limitations on primary production in an individual-based dynamic vegetation model: Biogeosciences 11:2027–2054, https://doi.org/10.5194/bg-11-2027-2014.
Sommers, A.N., Otto-Bliesner, B.L., Lipscomb, W.H., Lofverstrom, M., Shafer, S.L., Bartlein, P.J., Brady, E.C., Kluzek, E., Leguy, G., Thayer-Calder, K., Tomas, R.A., 2021, Retreat and regrowth of the Greenland Ice Sheet during the Last Interglacial as simulated by the CESM2-CISM2 coupled climate–ice sheet model. Community Earth System Model version 2 (CESM2) Special Collection: Paleoceanography and Paleoclimatology 36:e2021PA004272, https://doi.org/10.1029/2021PA004272.