Critical Mineral Deposits Database - Chino Porphyry Copper Mine Schematic
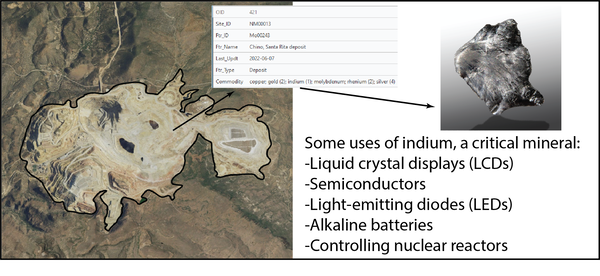
Critical Mineral Deposits Database - Chino Porphyry Copper Mine SchematicSchematic of the Chino porphyry copper (Cu) mine, New Mexico, showing the outline of the open pit operations, how it is attributed in the USMIN Mineral Deposit Database and how indium extracted from this deposit are used.