
Schematic map of the Colorado Mineral Belt and constituent geologic features.
Images
Images
Filter Total Items: 103
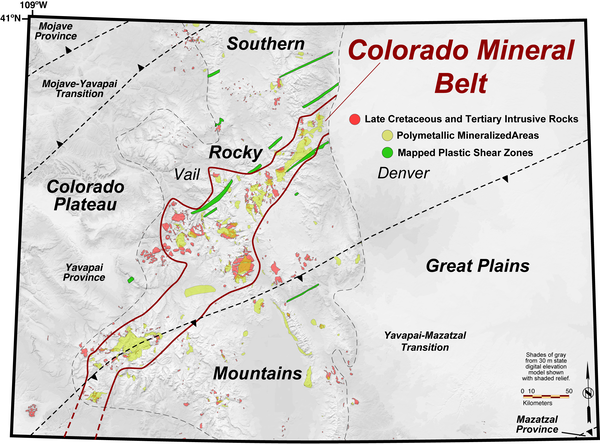
Colorado Mineral Belt location map
Schematic map of the Colorado Mineral Belt and constituent geologic features.
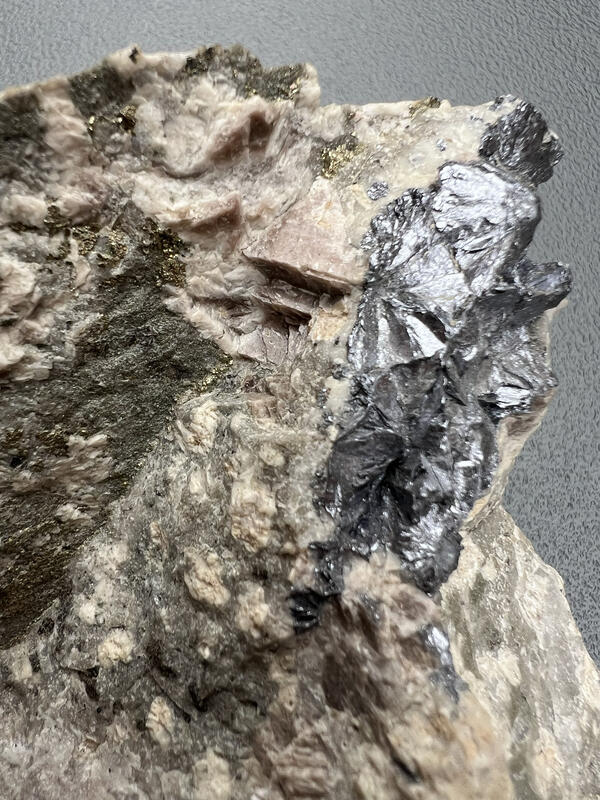
Molybdenite mineralization, Henderson porphyry Mo deposit, Colorado
Molybdenite mineralization, Henderson porphyry Mo deposit, ColoradoMolybdenite mineralization from the Henderson porphyry molybdenum (Mo) deposit associated with quartz and pyrite alteration. The Henderson molybdenum mine is located in Colorado.
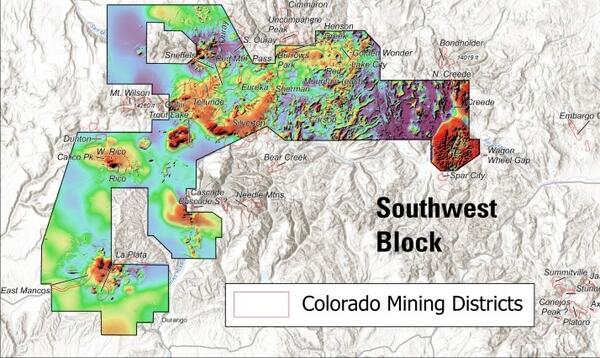
Southwest block Colorado Mineral Belt geophysical data map
Southwest block Colorado Mineral Belt geophysical data mapMap of southwest block of Colorado Mineral Belt geophysical data.
Southwest block Colorado Mineral Belt geophysical data map
Southwest block Colorado Mineral Belt geophysical data mapMap of southwest block of Colorado Mineral Belt geophysical data.
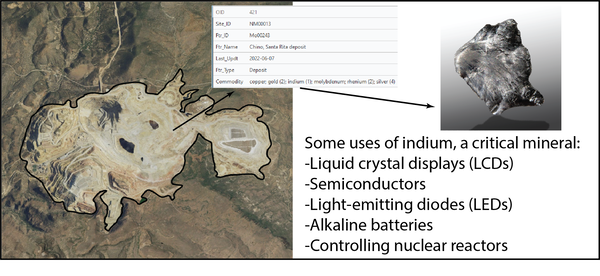
Critical Mineral Deposits Database - Chino Porphyry Copper Mine Schematic
Critical Mineral Deposits Database - Chino Porphyry Copper Mine SchematicSchematic of the Chino porphyry copper (Cu) mine, New Mexico, showing the outline of the open pit operations, how it is attributed in the USMIN Mineral Deposit Database and how indium extracted from this deposit are used.
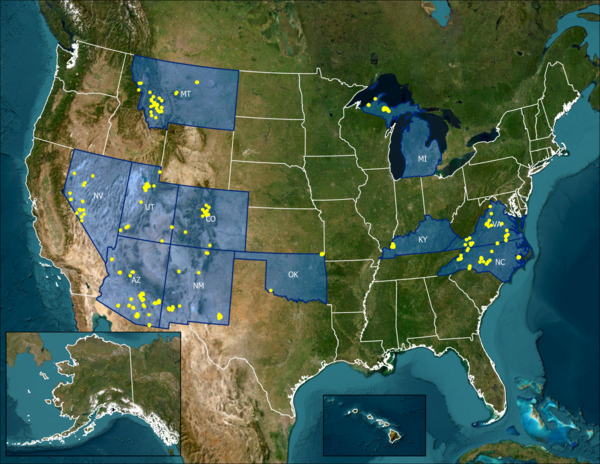
National Mine Waste Inventory Map
Map of the locations of mine waste features included in the current version of the National Mine Waste Inventory data release (https://doi.org/10.5066/P148EEUA).
Map of the locations of mine waste features included in the current version of the National Mine Waste Inventory data release (https://doi.org/10.5066/P148EEUA).
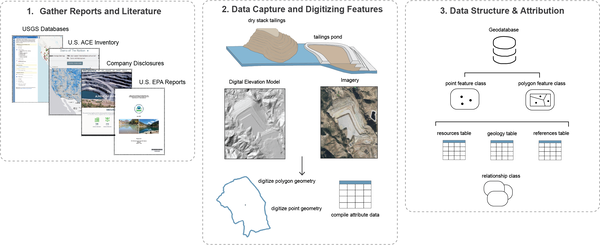
National Mine Waste Inventory Workflow Schematic
Schematic diagram showing how mine waste features were captured and attributed as part of their inclusion in the new National Mine Waste Inventory data release (https://doi.org/10.5066/P148EEUA).
Schematic diagram showing how mine waste features were captured and attributed as part of their inclusion in the new National Mine Waste Inventory data release (https://doi.org/10.5066/P148EEUA).
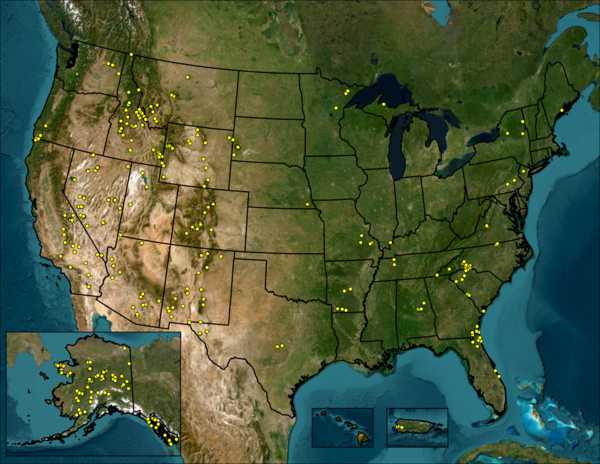
USMIN Mineral Deposit Database Map of Deposits
Map of the published sites within the USMIN Mineral Deposit Database, shown as yellow points.
Map of the published sites within the USMIN Mineral Deposit Database, shown as yellow points.
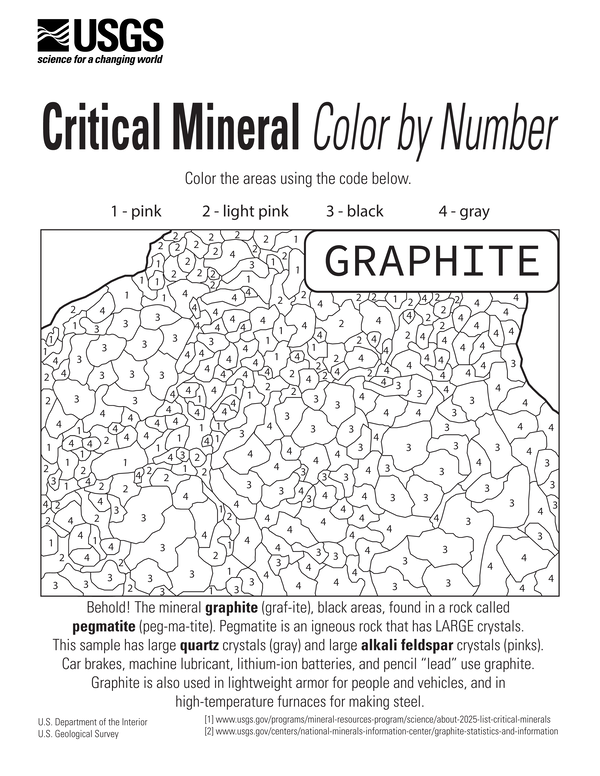
USGS MRP Color by Number: Graphite
USGS Mineral Resources Program color by number for the critical mineral graphite.
USGS Mineral Resources Program color by number for the critical mineral graphite.
USGS MRP Coloring Page Cassiterite
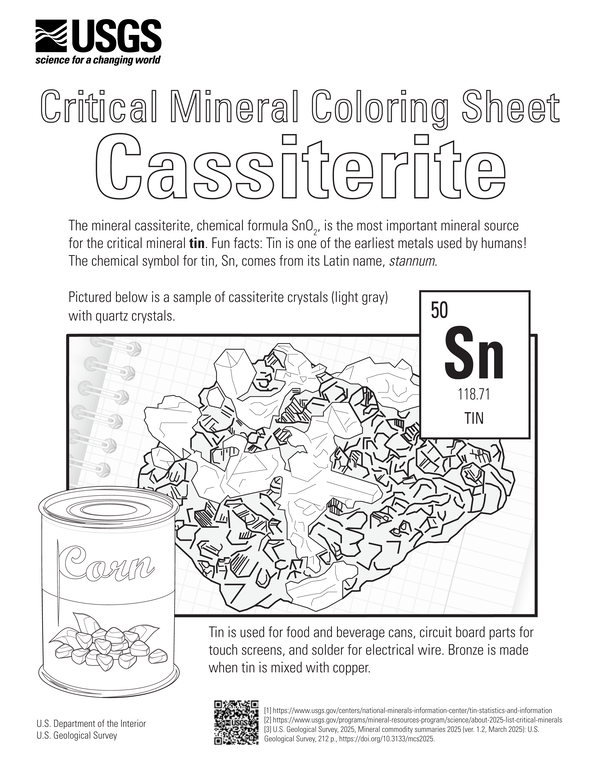
USGS Mineral Resources Program coloring page for cassiterite and the critical mineral tin.
The mineral cassiterite, chemical formula SnO2, is the most important mineral source for the critical mineral tin. Fun facts: tin is one of the earliest metals used by humans! The chemical symbol for tin, Sn, comes from its Latin name, stannum.
USGS MRP Coloring Page Barite
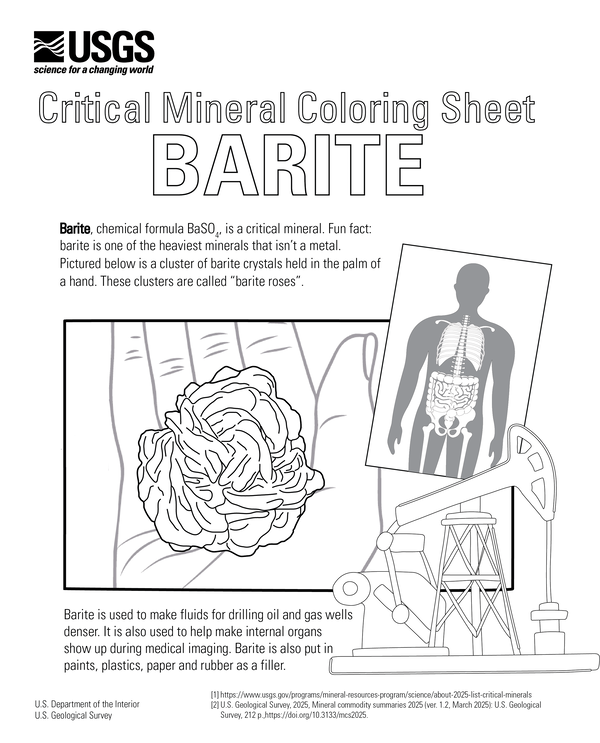
USGS Mineral Resources Program coloring page for the critical mineral barite.
Barite, chemical formula BaSO4, is a critical mineral. Fun fact: barite is one of the heaviest minerals that isn't a metal.
USGS Mineral Resources Program coloring page for the critical mineral barite.
Barite, chemical formula BaSO4, is a critical mineral. Fun fact: barite is one of the heaviest minerals that isn't a metal.
USGS MRP Critical Mineral Crossword Puzzle: Rhenium
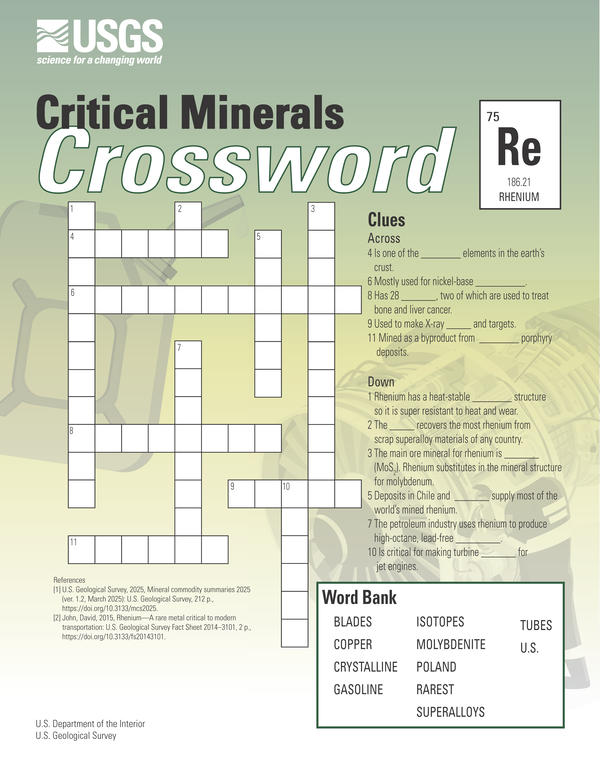
USGS MRP Critical Mineral Crossword Puzzle: RheniumCritical Mineral Crossword Puzzle: Rhenium.
Rhenium is listed as "critical mineral". Learn about where we get rhenium and how we use it by solving the crossword puzzle clues!
More information
USGS MRP Critical Mineral Crossword Puzzle: Rhenium
USGS MRP Critical Mineral Crossword Puzzle: RheniumCritical Mineral Crossword Puzzle: Rhenium.
Rhenium is listed as "critical mineral". Learn about where we get rhenium and how we use it by solving the crossword puzzle clues!
More information
USGS MRP Coloring Page Galena
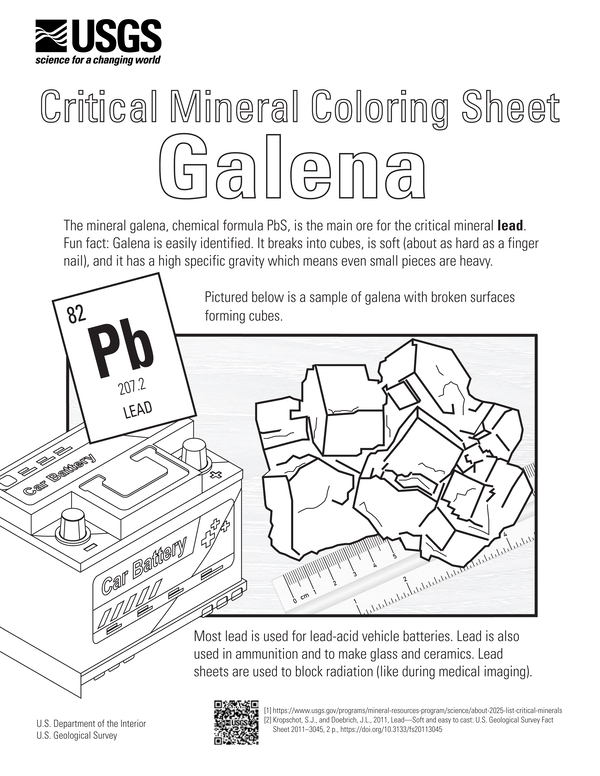
USGS Mineral Resources Program coloring page for the mineral galena and the critical mineral lead.
USGS Mineral Resources Program coloring page for the mineral galena and the critical mineral lead.
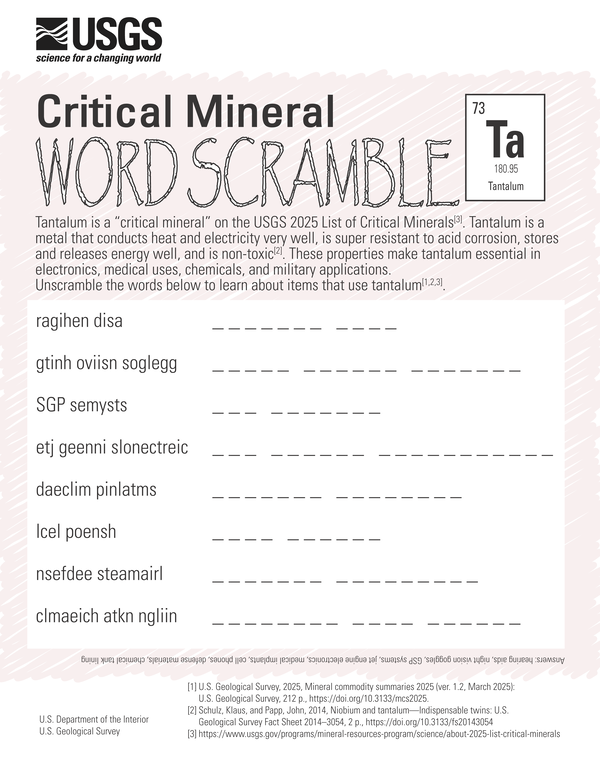
USGS MRP Critical Mineral Word Scramble Puzzle: Tantalum
USGS MRP Critical Mineral Word Scramble Puzzle: TantalumUSGS Mineral Resources Program Critical Mineral Word Scramble Puzzle: Tantalum
USGS MRP Critical Mineral Word Scramble Puzzle: Tantalum
USGS MRP Critical Mineral Word Scramble Puzzle: TantalumUSGS Mineral Resources Program Critical Mineral Word Scramble Puzzle: Tantalum
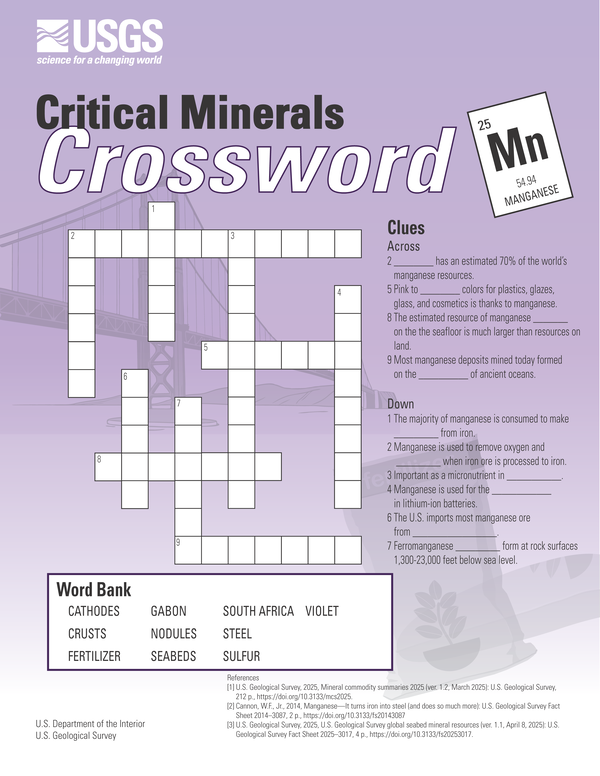
USGS MRP Critical Mineral Crossword Puzzle: Manganese
USGS MRP Critical Mineral Crossword Puzzle: ManganeseCritical Mineral Crossword Puzzle: Manganese
Manganese is listed as a "critical mineral". Learn about where we get manganese and how we use it by solving the crossword puzzle clues!
More information:
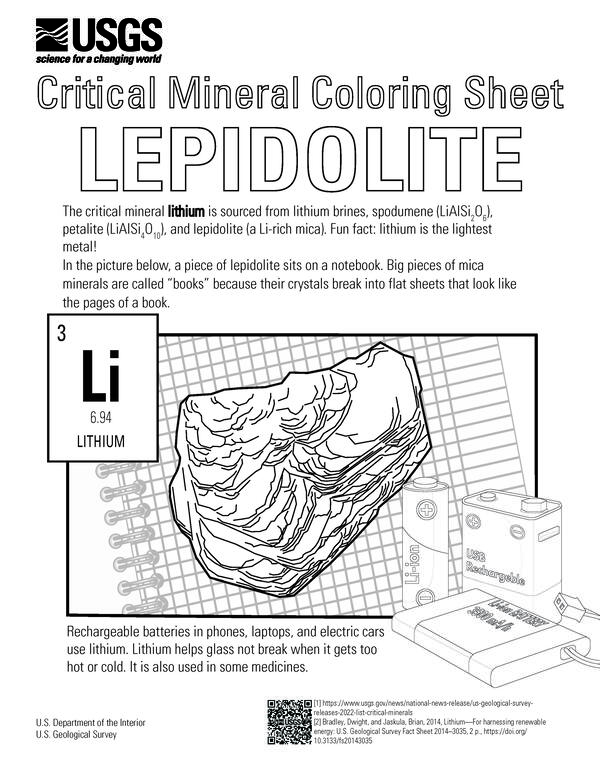
USGS MRP Coloring Page Lepidolite
Critical Minerals Coloring Sheet: lepidolite
The critical mineral lithium is sourced from lithium brines, spodumene (LiAlSi2O6), petalite (LiAlSi4O10), and lepidolite (a Li-rich mica). Fun fact: lithium is the lightest metal!
Critical Minerals Coloring Sheet: lepidolite
The critical mineral lithium is sourced from lithium brines, spodumene (LiAlSi2O6), petalite (LiAlSi4O10), and lepidolite (a Li-rich mica). Fun fact: lithium is the lightest metal!
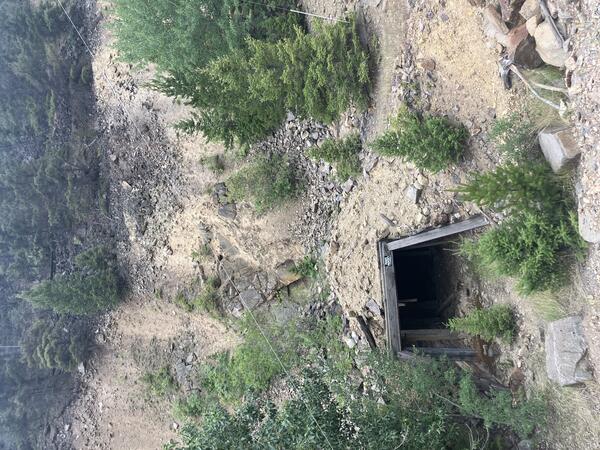
Abandoned Mine Shaft, Outside of Boulder, MT
Abandoned mine, including exposed shaft and mine dump features, located outside of Boulder, Montana.
Abandoned mine, including exposed shaft and mine dump features, located outside of Boulder, Montana.
Investigating the mineral potential of the Boulder batholith Geonarrative
Investigating the mineral potential of the Boulder batholith GeonarrativeScreenshot of initial view for geonarrative, "Investigating the mineral potential of the Boulder batholith", available at https://geonarrative.usgs.gov/investigatebbmineralpot/.

Post Laser Ablation Crater (video frame)
Frame from a short video is of a post laser ablation crater using a nanosecond 193nm laser ablation system of a glass slide using a 210 micron spot diameter and 250 shots. It shows a flat bottom crater indicative of a homogenized laser beam, though the measured diameter of the crater appears to be 25 microns smaller the diameter set. The 3D crater image
Frame from a short video is of a post laser ablation crater using a nanosecond 193nm laser ablation system of a glass slide using a 210 micron spot diameter and 250 shots. It shows a flat bottom crater indicative of a homogenized laser beam, though the measured diameter of the crater appears to be 25 microns smaller the diameter set. The 3D crater image

Multidisciplinary approach to prioritize critical elements for environmental research.
Multidisciplinary approach to prioritize critical elements for environmental research.This infographic introduces an approach that could subsequently be used to prioritize environmental research for the full range of critical elements.
By
Ecosystems Mission Area, Energy and Mineral Resources Mission Area, Contaminant Biology, Environmental Health Program, Toxic Substances Hydrology, Geology, Energy & Minerals Science Center, Geology, Geophysics, and Geochemistry Science Center, Geology, Minerals, Energy, and Geophysics Science Center

Pie Chart Showing Relative Amounts of Copper Produced in Leading Copper Producing States in 2019
Pie Chart Showing Relative Amounts of Copper Produced in Leading Copper Producing States in 2019Pie chart showing relative amounts of copper produced by leading copper producing states in the U.S. in 2019 (derived from data in Flanagan, D.M., 2019, Copper, in Metals and minerals: U.S. Geological Survey Minerals Yearbook 2019, v. 1, p. 20.1-20.30.

Porphyry.Copper.Map_.John_.and_.Others.2010.jpg
Global map showing locations of porphyry copper deposits from John, D.A., Ayuso, R.A., Barton, M.D., Blakely, R.J., Bodnar, R.J., Dilles, J.H., Gray, Floyd, Graybeal, F.T., Mars, J.C., McPhee, D.K., Seal, R.R., Taylor, R.D., and Vikre, P.G., 2010, Porphyry copper deposit model, chap. B of Mineral deposit models for resource assessment: U.S.
Global map showing locations of porphyry copper deposits from John, D.A., Ayuso, R.A., Barton, M.D., Blakely, R.J., Bodnar, R.J., Dilles, J.H., Gray, Floyd, Graybeal, F.T., Mars, J.C., McPhee, D.K., Seal, R.R., Taylor, R.D., and Vikre, P.G., 2010, Porphyry copper deposit model, chap. B of Mineral deposit models for resource assessment: U.S.