U.S. flag

An official website of the United States government

Images

Explore our planet and learn more about our work through photographs and imagery from scientists and support staff.

Filter Total Items: 408
Map of the Chesapeake Bay Nontidal Network showing Total Nitrogen trends and changes in flow-normalized yield, 2014-2023
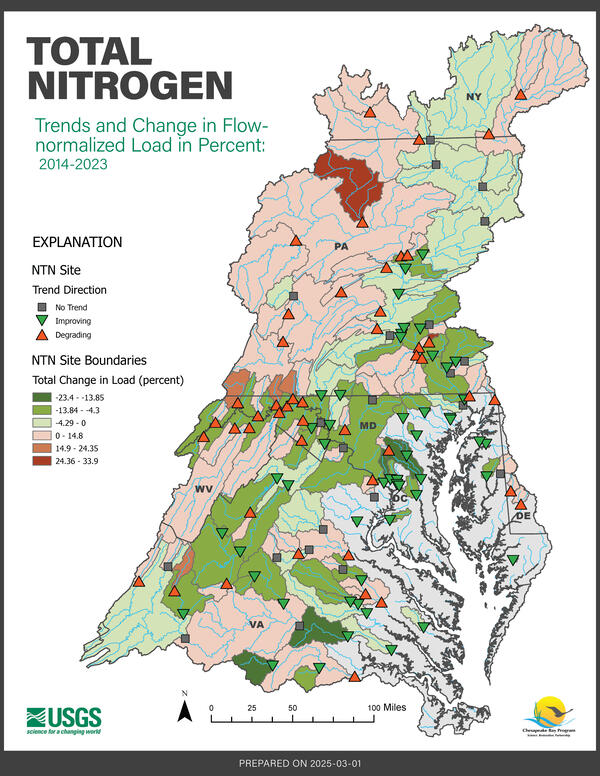
Chesapeake Bay Nontidal Network: 2014-2023 Total Nitrogen 10-year Trends and Change in Flow-normalized Per Acre Loads
Map of the Chesapeake Bay Nontidal Network showing suspended sediment trends and changes in flow-normalized yield, 2014-2023
Chesapeake Bay Nontidal Network: 2014-2023 Suspended Sediment 10-year Trends and Change in Flow-normalized Per Acre Loads
Map of the Chesapeake Bay Nontidal Network showing Nitrate + Nitrite Average 5-year Yield from 2019-2023
Chesapeake Bay Nontidal Network: 2019-2023 Nitrate + Nitrite Average 5-year Per-Acre Load

This map displays the average 5-year per acre loads, also known as yields, of nitrate + nitrite, also known as total inorganic nitrogen, across the Chesapeake Bay Watershed from 2019 to 2023. 

Map of the Chesapeake Bay Nontidal Network showing Total Nitrogen trends and changes in flow-normalized load, 2014-2023
Chesapeake Bay Nontidal Network: 2014-2023 Total Nitrogen 10-year Trends and Percent Change in Flow-normalized Loads
Map of the Chesapeake Bay Nontidal Network showing Total P long term trends and percent change in flow-normalized load
Chesapeake Bay Nontidal Network: 1985-2023 Total Phosphorus Trends and Percent Change in Flow-Normalized Load

This map displays the long term trend for total phosphorus, as well as the percent total change in flow-normalized loads for total phosphorus across the Chesapeake Bay Watershed from 1985 to 2023. 

Map of the Chesapeake Bay Nontidal Network showing suspended sediment long term trends and %change in flow-normalized load
Chesapeake Bay Nontidal Network: 1985-2023 Suspended Sediment Trends and Percent Change in Flow-Normalized Load

This map displays the long term trend for suspended sediment, as well as the percent total change in flow-normalized loads for suspended sediment across the Chesapeake Bay Watershed from 1985 to 2023. 

Map of the Chesapeake Bay Nontidal Network showing Total Nitrogen long term trend and change in flow-normalized per acre load
Chesapeake Bay Nontidal Network: 1985-2023 Total Nitrogen Trends and Change in Flow-Normalized Per Acre Load

This map displays the long-term trend for total nitrogen, as well as the total change in flow-normalized per-acre loads for total nitrogen across the Chesapeake Bay Watershed from 1985 to 2023. 

Map of the Chesapeake Bay Nontidal Network showing Suspended Sediment Average trend and 10-year yield from 2014-2023
Chesapeake Bay Nontidal Network: 2014-2023 Suspended Sediment 10-year Trend and Per-Acre Load

This map displays the average 10-year trends and per acre loads, also known as yields, of suspended sediment across the Chesapeake Bay Watershed from 2014 to 2023. 

Chesapeake Bay Nontidal Network: 1985-2023 Orthophosphate Trends and Change in Flow-Normalized Per Acre Load

This map displays the long-term trend for orthophosphate, as well as the total change in flow-normalized per-acre loads for orthophosphate across the Chesapeake Bay Watershed from 1985 to 2023. 

Map of the Chesapeake Bay Nontidal Network showing sediment long term trend and change in flow-normalized per acre load
Chesapeake Bay Nontidal Network: 1985-2023 Suspended Sediment Trends and Change in Flow-Normalized Per Acre Load

This map displays the long-term trend for suspended sediment, as well as the total change in flow-normalized per-acre loads for suspended sediment across the Chesapeake Bay Watershed from 1985 to 2023. 

Map of the Chesapeake Bay Nontidal Network showing Total Nitrogen Average 5-year yield from 2019-2023
Chesapeake Bay Nontidal Network: 2019-2023 Total Nitrogen Average 5-year Per-Acre Load
Map of the Chesapeake Bay Nontidal Network showing Nitrate + Nitrite trends and changes in flow-normalized load, 2014-2023
Chesapeake Bay Nontidal Network: 2014-2023 Nitrate + Nitrite 10-year Trends and Percent Change in Flow-normalized Loads

This map displays the 10-year trend for nitrate + nitrate (also known as inorganic nitrogen), as well as the percent total change in flow-normalized loads for nitrate + nitrite across the Chesapeake Bay Watershed from 2014 to 2023. 

Map of the Chesapeake Bay Nontidal Network showing Total Nitrogen Average 10-year yield from 2014-2023
Chesapeake Bay Nontidal Network: 2014-2023 Total Nitrogen Average 10-year Per-Acre Load
Map of the Chesapeake Bay Nontidal Network showing Total Nitrogen 10-year yield and trend from 2014-2023
Chesapeake Bay Nontidal Network: 2014-2023 Total Nitrogen 10-year Trend and Per-Acre Load

This map displays the average 10-year trends and per acre loads, also known as yields, of total nitrogen across the Chesapeake Bay Watershed from 2014 to 2023. 

Map of the Chesapeake Bay Nontidal Network showing Nitrate + Nitrite Average trend and 10-year yield from 2014-2023
Chesapeake Bay Nontidal Network: 2014-2023 Total Nitrogen 10-year Trend and Per-Acre Load

This map displays the average 10-year trends and per acre loads, also known as yields, of nitrate + nitrite across the Chesapeake Bay Watershed from 2014 to 2023. 

Map of the Chesapeake Bay Nontidal Network showing Total Phosphorus Average trend and 10-year yield from 2014-2023
Chesapeake Bay Nontidal Network: 2014-2023 Total Phosphorus 10-year Trend and Per-Acre Load

This map displays the average 10-year trends and per acre loads, also known as yields, of total phosphorus across the Chesapeake Bay Watershed from 2014 to 2023. 

Map of the Chesapeake Bay Nontidal Network showing orthophosphate Average trend and 10-year yield from 2014-2023
Chesapeake Bay Nontidal Network: 2014-2023 Orthophosphate 10-year Trend and Per-Acre Load

This map displays the average 10-year trends and per acre loads, also known as yields, of orthophosphate across the Chesapeake Bay Watershed from 2014 to 2023. 

USGS water expert Jeremy White measures how high and fast floodwaters are moving at Piney Creek near Raleigh, WV.
USGS water expert measures floodwaters at Piney Creek near Raleigh, WV.

USGS water expert Jeremy White measures how high and fast floodwaters are moving at Piney Creek near Raleigh, WV. He's using special water measurement equipment (a hydroacoustic doppler profiler) to collect this data. 

USGS water expert Jeremy White measures how high and fast floodwaters are moving at Piney Creek near Raleigh, WV. He's using special water measurement equipment (a hydroacoustic doppler profiler) to collect this data. 

Was this page helpful?