
The USGS and local partners hosted a meeting at the War Branch monitoring station to share water-quality and conservation work happening in the watershed with farmers, environmental and agricultural agencies, nonprofit groups, and local universities.
Images
Explore our planet and learn more about our work through photographs and imagery from scientists and support staff.
Filter Total Items: 408

Outreach Event at War Branch
The USGS and local partners hosted a meeting at the War Branch monitoring station to share water-quality and conservation work happening in the watershed with farmers, environmental and agricultural agencies, nonprofit groups, and local universities.

Water Quality Sampling Equipment Show-and-Tell
USGS scientists Jimmy Webber and Dan Burns explain how water quality equipment is used to take measurements at War Branch and other monitoring stations.
USGS scientists Jimmy Webber and Dan Burns explain how water quality equipment is used to take measurements at War Branch and other monitoring stations.

Visit to the War Branch Bioreactor
Community partners tour the bioreactor at War Branch.
The War Branch bioreactor was installed below a natural spring in the War Branch watershed. The USGS had previously measured elevated nitrate concentrations from this spring.
Community partners tour the bioreactor at War Branch.
The War Branch bioreactor was installed below a natural spring in the War Branch watershed. The USGS had previously measured elevated nitrate concentrations from this spring.

Shallow Groundwater Sample from the Banks of the Shenandoah River
Shallow Groundwater Sample from the Banks of the Shenandoah RiverA groundwater sample taken from a shallow piezometer near USGS surface water monitoring station 01634000 near Strausburg.
Shallow Groundwater Sample from the Banks of the Shenandoah River
Shallow Groundwater Sample from the Banks of the Shenandoah RiverA groundwater sample taken from a shallow piezometer near USGS surface water monitoring station 01634000 near Strausburg.

Collecting groundwater samples near the Shenandoah River
Collecting groundwater samples near the Shenandoah RiverTwo USGS scientists collecting groundwater samples from a piezometer along the bank of the North Fork Shenandoah River near Strausburg
This photo was taken as a part of the Shenandoah River HABs Project.

South Fork Shenandoah River after Hurricane Debby
The South Fork of the Shenandoah River near Rileyville shortly after Hurricane Debby. Storms often lead to flooding, high water levels, and increased water velocities that lead to increased sediment transport downstream.
The South Fork of the Shenandoah River near Rileyville shortly after Hurricane Debby. Storms often lead to flooding, high water levels, and increased water velocities that lead to increased sediment transport downstream.

Storm Debris in the Shenandoah River South Fork after Hurricane Debby
Storm Debris in the Shenandoah River South Fork after Hurricane DebbyThe South Fork of the Shenandoah River near Rileyville shortly after Hurricane Debby. Storms often lead to flooding, high water levels, and increased water velocities that lead to increased sediment transport downstream. Floods can also carry large amounts of debris, which collect in backwaters or get caught in trees along the riverbank.

Methods of Measuring Land Motion
A representation of the various methods used by the USGS to measure subsidence.
A representation of the various methods used by the USGS to measure subsidence.
Algal Mat from a Harmful Algal Bloom
Algae growing in a backwater section along the streambank of the south fork of the Shenandoah River near Lynnwood, Virginia.
This photo was taken as a part of the Shenandoah River HABs Project.
Algae growing in a backwater section along the streambank of the south fork of the Shenandoah River near Lynnwood, Virginia.
This photo was taken as a part of the Shenandoah River HABs Project.

Algae Mat from a Harmful Algal Bloom
Algae growing over the rocky streambank of the south fork of the Shenandoah River near Lynnwood, Virginia.
This photo was taken as a part of the Shenandoah River HABs Project.
Algae growing over the rocky streambank of the south fork of the Shenandoah River near Lynnwood, Virginia.
This photo was taken as a part of the Shenandoah River HABs Project.

Monitoring equipment along the North Fork Shenandoah River
Monitoring equipment along the North Fork Shenandoah RiverA USGS scientist servicing a rail system along the banks of the North Fork Shenandoah River near Strausburg. Rail systems are used to deploy continuous water chemistry monitoring equipment in large rivers such as the Shenandoah.
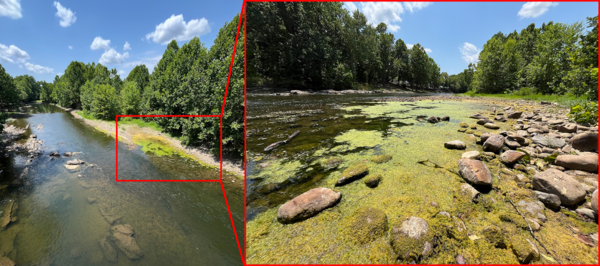
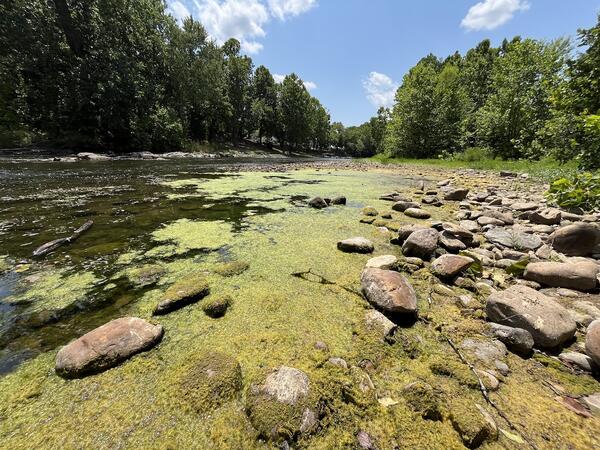
Algal Mat Forming Along a Backwater Section of the Shenandoah River
Algal Mat Forming Along a Backwater Section of the Shenandoah RiverA harmful algal bloom (HAB) event along the south fork of the Shenandoah River during the summer of 2024. This algal mat was forming along a backwater section of the riverbank near the water quality monitoring site near Lynnwood, Virginia.

South Fork of the Shenandoah River near Lynnwood
Algae growing along a backwater section along the streambank of the south fork of the Shenandoah River near Lynnwood, Virginia.
This photo was taken as a part of the Shenandoah River HABs Project.
Algae growing along a backwater section along the streambank of the south fork of the Shenandoah River near Lynnwood, Virginia.
This photo was taken as a part of the Shenandoah River HABs Project.

North Fork Shenandoah River during a Harmful Algal Bloom Event
North Fork Shenandoah River during a Harmful Algal Bloom EventNorth Fork Shenandoah River during a Harmful Algal Bloom (HAB) event.
This photo was taken near Town Park in Strausburg, and is a part of the Shenandoah River HABs Project.
North Fork Shenandoah River during a Harmful Algal Bloom Event
North Fork Shenandoah River during a Harmful Algal Bloom EventNorth Fork Shenandoah River during a Harmful Algal Bloom (HAB) event.
This photo was taken near Town Park in Strausburg, and is a part of the Shenandoah River HABs Project.
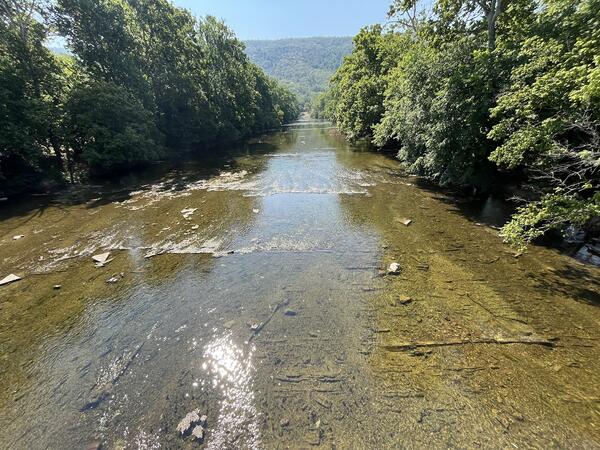
Deer Rapids after a HABs Event
Deer Rapids, on the North Fork of the Shenandoah River in Virginia, after a harmful algal bloom (HAB) event. Note how the dark greenish-brown, dead or dying filamentous algae still coats the riverbed.
Data for this monitoring site can be found at USGS Water Data for the Nation.
Deer Rapids, on the North Fork of the Shenandoah River in Virginia, after a harmful algal bloom (HAB) event. Note how the dark greenish-brown, dead or dying filamentous algae still coats the riverbed.
Data for this monitoring site can be found at USGS Water Data for the Nation.

Harmful Algal Bloom in the Shenandoah River North Fork
Harmful Algal Bloom in the Shenandoah River North ForkUSGS scientist Carly Maas observing a harmful algal bloom (HAB) event along the Shenandoah River North Fork.
This photo was taken as a part of the Shenandoah River HABs Project.
Harmful Algal Bloom in the Shenandoah River North Fork
Harmful Algal Bloom in the Shenandoah River North ForkUSGS scientist Carly Maas observing a harmful algal bloom (HAB) event along the Shenandoah River North Fork.
This photo was taken as a part of the Shenandoah River HABs Project.

Monitoring Station Installation at War Branch
USGS scientists Hillary Dozier and Jimmy Webber work on installing a monitoring station at War Branch. NWIS data for this site can be found here.
USGS scientists Hillary Dozier and Jimmy Webber work on installing a monitoring station at War Branch. NWIS data for this site can be found here.

USGS Scientist Aaron Porter at the Long Branch Monitoring Station
USGS Scientist Aaron Porter at the Long Branch Monitoring StationAaron Porter, Project Chief and Principal Investigator of the Fairfax County Water Resources Monitoring Network, standing in front of the gage house at the Long Branch Monitoring Station.

Water chemistry monitoring equipment covered in algae
Water chemistry monitoring equipment covered in algaeWater quality monitoring sensors attached to a rail system along the banks of the North Fork Shenandoah River near Strausburg. Rail systems are used to deploy continuous water chemistry monitoring equipment in large rivers such as the Shenandoah.

USGS Hydrologic Technician Logging Data
USGS hydrologic technician Erik Kaseloo logging data in the field. Instruments deployed at water quality monitoring sites collect a variety of data that has to be downloaded so scientists can analyze the results.
USGS hydrologic technician Erik Kaseloo logging data in the field. Instruments deployed at water quality monitoring sites collect a variety of data that has to be downloaded so scientists can analyze the results.