
Imperial Geyser hot spring pool in Yellowstone National Park is about 30 m (about 100 ft) across and contains alkaline-Cl waters with a steam vent in the pool and mudpots outside the pool area (in the upper right part of this photo). USGS Photo by Pat Shanks, 2019.
Images
Images of Yellowstone.
Filter Total Items: 687

Imperial Geyser looking south, Yellowstone
Imperial Geyser hot spring pool in Yellowstone National Park is about 30 m (about 100 ft) across and contains alkaline-Cl waters with a steam vent in the pool and mudpots outside the pool area (in the upper right part of this photo). USGS Photo by Pat Shanks, 2019.

Annie Carlson, Research Permitting Coordinator for Yellowstone National Park during 2017–2023, during a winter ski expedition in the park
Annie Carlson, Research Permitting Coordinator for Yellowstone National Park during 2017–2023, during a winter ski expedition in the parkAnnie Carlson, Research Permitting Coordinator for Yellowstone National Park during 2017–2023, during a winter ski expedition in the park. National Park Service photo by Jon Nicholson, January 2020.

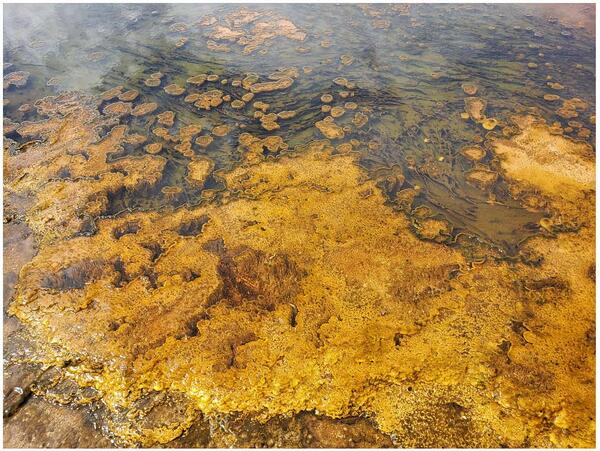
Small acidic hot spring in the Gibbon Geyser Basin of Yellowstone National Park
Small acidic hot spring in the Gibbon Geyser Basin of Yellowstone National ParkAn unnamed small acidic (pH ~3) hot spring (with a temperature of about 55°C at the source) in the Gibbon Geyser Basin of Yellowstone National Park. The yellow region is due to the precipitation of sulfur by sulfide-oxidizing chemotrophic microorganisms.
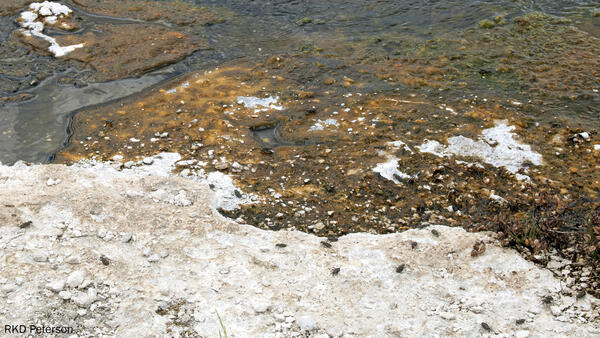
Adult tiger beetles near Midway Geyser Basin, Yellowstone National Park
Adult tiger beetles near Midway Geyser Basin, Yellowstone National ParkSeveral adult wetsalts tiger beetles hunting and basking on and around an alkaline hot spring near Midway Geyser Basin in Yellowstone National Park. Photo by Robert K. D. Peterson, 2019.

A digital elevation map of Yellowstone Caldera
Rhyolite lavas in the Yellowstone Caldera younger than 631,000 years
Rhyolite lavas in the Yellowstone Caldera younger than 631,000 years

Two models of magma storage beneath Yellowstone.
Models of magma storage. Part (A) depicts the standard model of magma storage—a single, large body of crystal-poor melt, surrounded by crystalline mush. Although this is the standard 'mush' model, geophysical studies fail to find evidence of this type of magma storage at many active systems.
Models of magma storage. Part (A) depicts the standard model of magma storage—a single, large body of crystal-poor melt, surrounded by crystalline mush. Although this is the standard 'mush' model, geophysical studies fail to find evidence of this type of magma storage at many active systems.

Map showing three types of young faults in Yellowstone National Park
Map showing three types of young faults in Yellowstone National ParkMap showing three types of young faults in Yellowstone National Park. 1) Resurgent dome faults. 2) Volcanism and caldera faults. 3) Basin and Range faults. Courtesy of the Wyoming State Geological Survey.

Sabrina Brown collecting samples from Yellowstone Lake core YL16-2C
Sabrina Brown collecting samples from Yellowstone Lake core YL16-2CSabrina Brown collecting samples from Yellowstone Lake core YL16-2C at the National Lacustrine Core Facility (LacCore) at the University of Minnesota.
Sabrina Brown collecting samples from Yellowstone Lake core YL16-2C
Sabrina Brown collecting samples from Yellowstone Lake core YL16-2CSabrina Brown collecting samples from Yellowstone Lake core YL16-2C at the National Lacustrine Core Facility (LacCore) at the University of Minnesota.

Mineral stability diagram showing minerals that are stable under changing temperature and dissolved silica concentrations at and just beneath the floor of Yellowstone Lake
Mineral stability diagram showing minerals that are stable under changing temperature and dissolved silica concentrations at and just beneath the floor of Yellowstone LakeMineral stability diagram showing minerals that are stable under changing temperature and dissolved silica concentrations that are found at and just beneath the floor of Yellowstone Lake. Two important points illustrated by this diagram are: (1) the minerals that are stable when reacted with vapor-dominated fluids (kaolinite, boehmite) differ substantially fro
Mineral stability diagram showing minerals that are stable under changing temperature and dissolved silica concentrations at and just beneath the floor of Yellowstone Lake
Mineral stability diagram showing minerals that are stable under changing temperature and dissolved silica concentrations at and just beneath the floor of Yellowstone LakeMineral stability diagram showing minerals that are stable under changing temperature and dissolved silica concentrations at and just beneath the floor of Yellowstone Lake
Mineral stability diagram showing minerals that are stable under changing temperature and dissolved silica concentrations at and just beneath the floor of Yellowstone LakeMineral stability diagram showing minerals that are stable under changing temperature and dissolved silica concentrations that are found at and just beneath the floor of Yellowstone Lake. Two important points illustrated by this diagram are: (1) the minerals that are stable when reacted with vapor-dominated fluids (kaolinite, boehmite) differ substantially fro

Contrasting photos of Heart Spring from 1988 and 2019 Yellowstone
Contrasting photos of Heart Spring from 1988 and 2019 YellowstoneContrasting photos of Heart Spring on Geyser Hill in the Upper Geyser Basin from 1998 (left) and 2019 (right). Can you spot differences in the hot spring? Photos courtesy of the National Park Service.
Alkaline hot spring outflow channel in the Biscuit Basin
Alkaline hot spring outflow channel in the Biscuit BasinA wide array of phototrophic microbial community textures exhibited in an alkaline (pH ~8.5) hot spring outflow channel in the Biscuit Basin, including thick mats, toadstools, ropes, and pinnacles. The differences in color are due to pigments (chlorophylls, bacteriochlorophylls, and carotenoids) produced by phototrophic microorganisms.

Sapphire Pool, in the Biscuit Basin area of the Upper Geyser Basin, Yellowstone National Park
Sapphire Pool, in the Biscuit Basin area of the Upper Geyser Basin, Yellowstone National ParkSapphire Pool, an alkaline (pH ~7.5) spring in the Biscuit Basin area of the Upper Geyser Basin, Yellowstone National Park.

Map of seismicity in the Yellowstone region during 2019.
Map of seismicity in the Yellowstone region during 2019.Map of seismicity (yellow circles) in the Yellowstone region during 2019. Gray lines are roads, red line shows the caldera boundary, Yellowstone National Park is outlined by black dashed line, and gray dashed lines denote state boundaries.

Map panels showing the distribution of caldera-forming tuff Yellowston
Map panels showing the distribution of caldera-forming tuff YellowstonMap panels showing the distribution of major caldera-forming ash-flow deposits from the three major caldera-forming eruptions on the Yellowstone Plateau Volcanic Field. Updated from Christiansen, 2001 (USGS PP 729-G) with new age information.

Map of Yellowstone National Park showing helium isotope values
Map of Yellowstone National Park showing helium isotope valuesColor-coded map showing the range of helium isotope values across Yellowstone National Park. BC = Boundary Creek, GGB = Gibbon Geyser Basin, MHS = Mammoth Hot Springs.
Map of Yellowstone National Park showing helium isotope values
Map of Yellowstone National Park showing helium isotope valuesColor-coded map showing the range of helium isotope values across Yellowstone National Park. BC = Boundary Creek, GGB = Gibbon Geyser Basin, MHS = Mammoth Hot Springs.

Image of Yellowstone Lake showing location of core YL16-2C
Image of Yellowstone Lake showing location of core YL16-2CA digital elevation map of Yellowstone National Park (left) with the location of Yellowstone Lake indicated by the white box. Satellite image (right) of the study site with collection location of core YL16-2C shown by the red circle. Map was originally published in Sabrina Brown’s dissertation (2019).

Maps of evolution stages of recent volcanism in Yellowstone Caldera
Maps of evolution stages of recent volcanism in Yellowstone CalderaMaps displaying the stages of evolution of the more recent cycle of volcanism associated with Yellowstone Caldera. From Finn and Morgan, 2002 (High-resolution aeromagnetic mapping of volcanic terrain, Yellowstone National Park).

Microscopic image of quartz crystal from Lave Creek Tuff Yellowstone
Microscopic image of quartz crystal from Lave Creek Tuff YellowstoneSynchrotron X-Ray microtomography 3D image (a) and cathodoluminescence slice (b) from the same reentrant-bearing quartz crystal from the Lava Creek Tuff. The reentrants are in darker blue in (a) and the black cavities in (b). Note their relationship to quartz growth bands. Red domains are small magnetite crystals.

Summary geologic record of the Huckleberry Ridge Tuff eruption
Summary geologic record of the Huckleberry Ridge Tuff eruptionSummary diagram of the geological record and timing of the Huckleberry Ridge Tuff eruption. See Swallow et al. (2019) for more details.
Summary geologic record of the Huckleberry Ridge Tuff eruption
Summary geologic record of the Huckleberry Ridge Tuff eruptionSummary diagram of the geological record and timing of the Huckleberry Ridge Tuff eruption. See Swallow et al. (2019) for more details.

Box diagram and map showing sources and fate of geothermal solutes in the Yellowstone River
Box diagram and map showing sources and fate of geothermal solutes in the Yellowstone RiverThe Yellowstone River is divided into five reaches (labeled and color-coded): Yellowstone Lake, Hayden Valley, Grand Canyon of the Yellowstone, Tower–Gardner, and Mammoth. Monitoring stations (yellow dots on map) between each reach of the river reaches allow geochemists to measure river composition and then determine the sources of chloride (Cl) and other solu

Map showing ice cover in the Yellowstone region
Map showing ice cover in the Yellowstone region. Light shaded areas bounded by black and red lines indicate areas covered during the Pinedale (about 20,000-15,000 years ago) and Bull Lake (about 150,000 years ago) glaciations, respectively. Blue lines are contours in thousands of feet on the maximum reconstructed Pinedale glacier surface.
Map showing ice cover in the Yellowstone region. Light shaded areas bounded by black and red lines indicate areas covered during the Pinedale (about 20,000-15,000 years ago) and Bull Lake (about 150,000 years ago) glaciations, respectively. Blue lines are contours in thousands of feet on the maximum reconstructed Pinedale glacier surface.