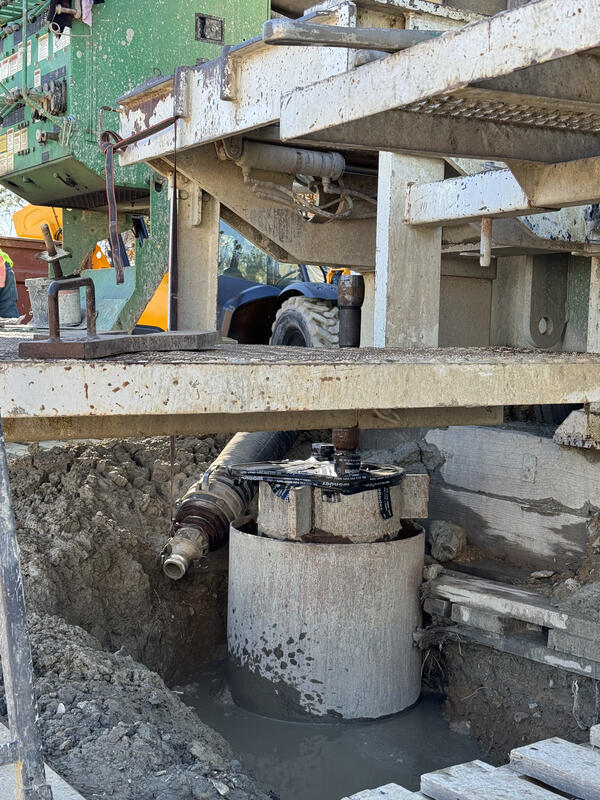
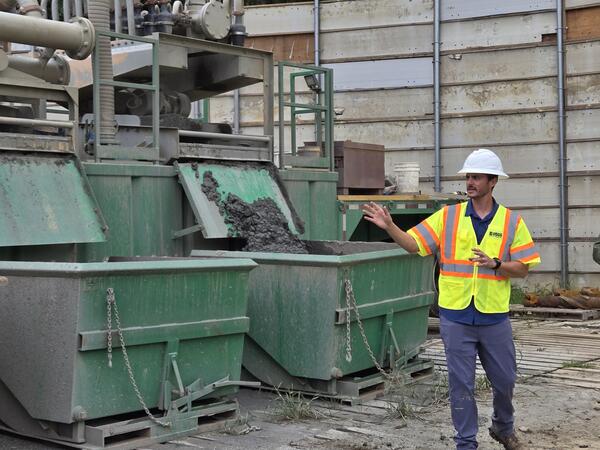
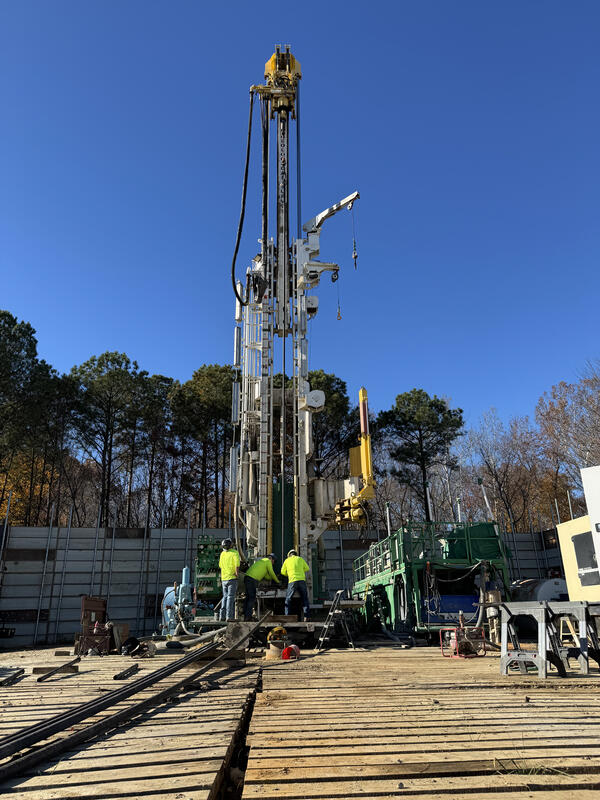
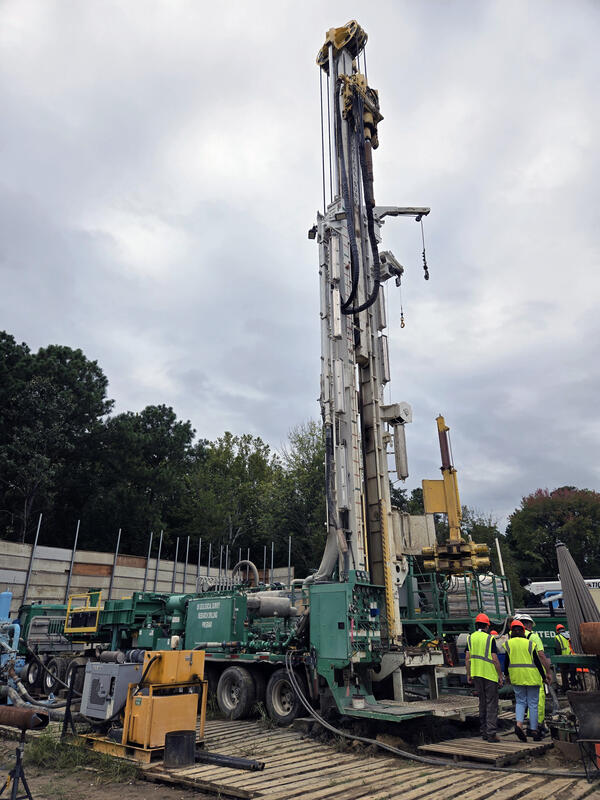
The USGS Nansemond pipe extensometer (59D 39) with a total depth of 1,960 feet.
Borehole Extensometer
Detailed Description
Borehole Extensometer
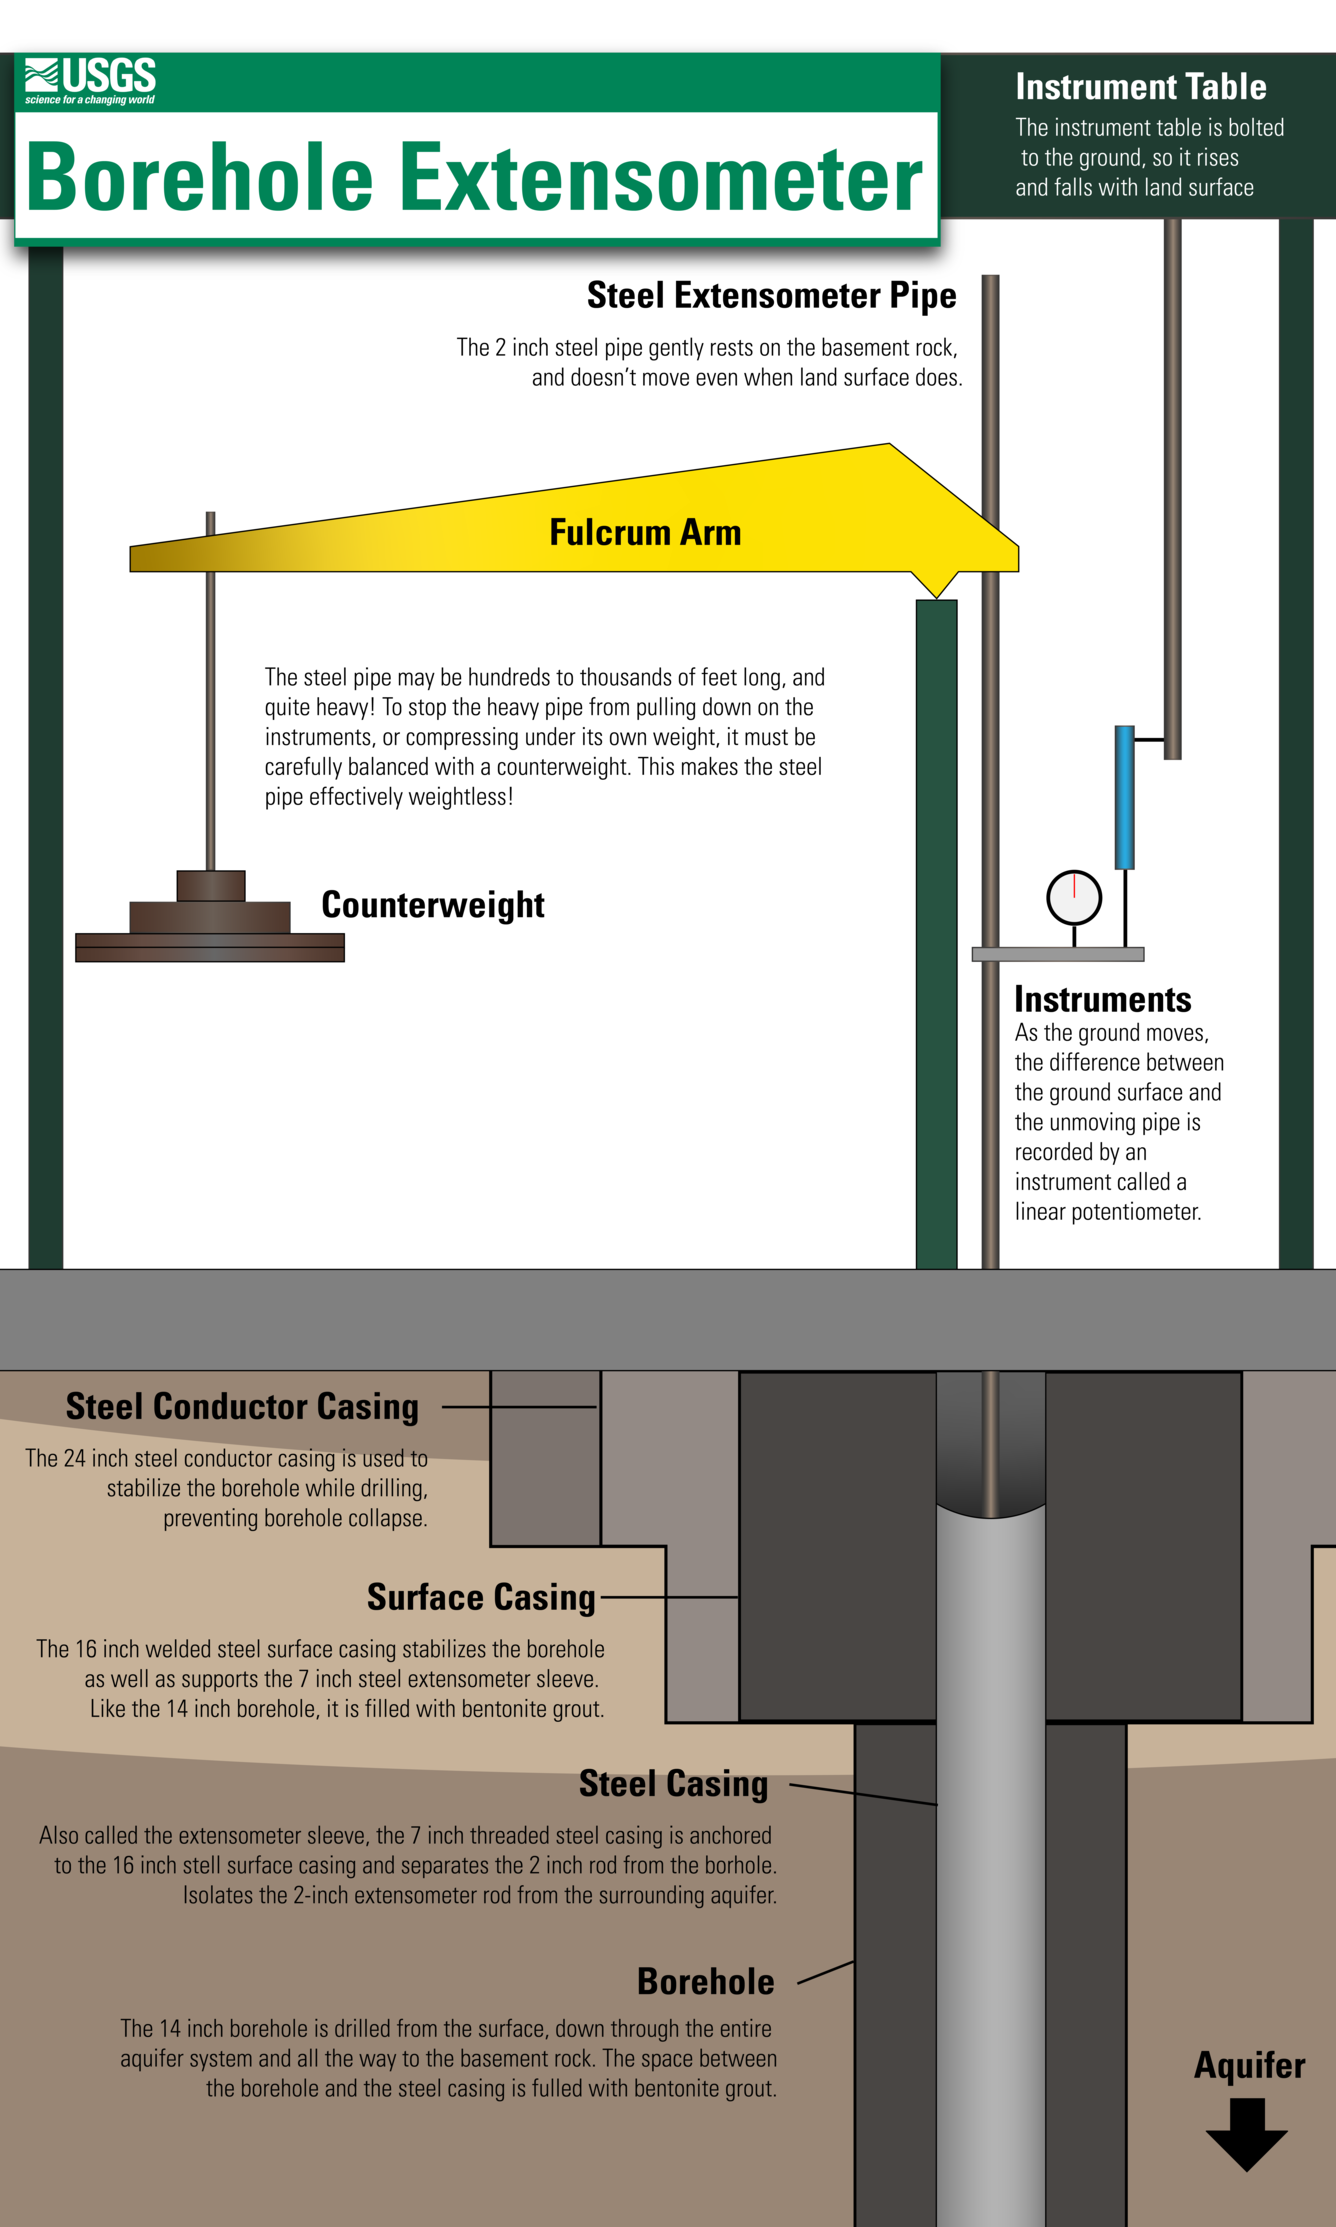
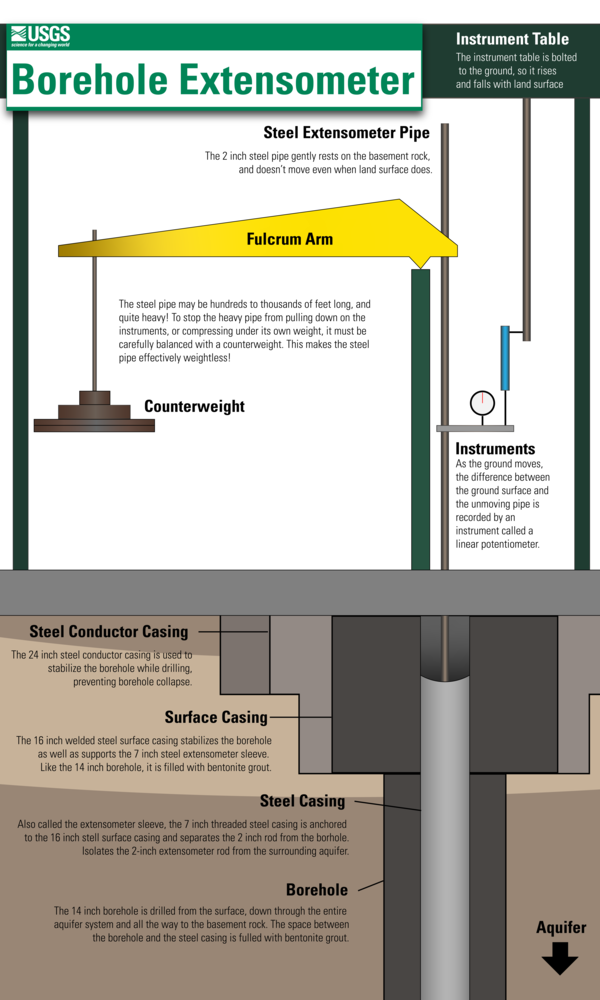
Borehole extensometers are highly sensitive instruments which measure aquifer compaction. This infographic explains the various parts of a borehole extensometer, and is modeled after the USGS extensometer at Nansemond, Virginia.
Instrument Table: The instrument table is bolted to the ground, so it rises and falls with land surface.
Steel Pipe: The steel pipe is anchored to the basement rock and doesn't move even when the land surface does.
Fulcrum Arm & Counterweight: The steel pipe may be hundreds to thousands of feet long, and quite heavy! To stop the heavy steel pipe from pulling down on the instruments, or compressing under its own weight, it must be carefully balanced with a counterweight. This makes the steel pipe effectively weightless!
Instruments: As the ground moves, the difference between the ground surface and the unmoving steel pipe is recorded by an instrument called a linear potentiometer.
Borehole: The borehole is drilled from the surface, down through the entire aquifer system and all the way to the basement rock. The steel pipe is anchored at the bottom of the borehole.
Sources/Usage
Public Domain.
Related
The Virginia Extensometer Network
Land Subsidence on the Virginia Coastal Plain
Below is a more detailed schematic of the Nansemond Extensometer, as well as photos of the extensometers in the Virginia Extensometer Network.
Nansemond Extensometer Schematic
This schematic shows the Nansemond borehole extensometer (USGS 365337076251606 59D 39) in cutaway profile. A 12 inch borehole extends down 2000.5 feet, with the last 41.5 feet being a cement base for the 2 inch steel extensometer pipe.
The USGS Nansemond pipe extensometer (59D 39) with a total depth of 1,960 feet.
The USGS Nansemond pipe extensometer (59D 39) showing the triangular table in green and the instrument bridge in yellow above the extensometer. The piers that support the table extend down 65 feet. The movement of the table relative to the extensometer is how land-surface movement is measured.
An analog dial gage (left) and a digital linear potentiometer (right with blue barrel) used to measure land-surface movement in response to aquifer system deformation at the USGS Nansemond extensometer.
Pivot block where the USGS Nansemond extensometer connects to the fulcrum arm.
Installing the linear potentiometer on the USGS Nansemond extensometer. The linear potentiometer is used to measure land-surface movement in response to aquifer system deformation at the USGS Nansemond extensometer.
The USGS Franklin pipe extensometer with a total depth of 860 feet.
Period of record: 1979-1995; 2016-present
The USGS Franklin pipe extensometer with a total depth of 860 feet.
Period of record: 1979-1995; 2016-present
The USGS Suffolk pipe extensometer with a total depth of 1,620 feet.
Period of record: 1982-1995; 2016-present
The USGS Suffolk pipe extensometer with a total depth of 1,620 feet.
Period of record: 1982-1995; 2016-present
Photo of the original Franklin extensometer taken during an inspection in 2015. Recording had ended in 1995, and between 1995 and 2015, groundwater pumping rates lessened causing the aquifer to briefly recover and the land to rebound. This rebound was so significant that it caused the damage to the extensometer seen above.
Image of the original extensometer at Franklin, Virginia, which recorded aquifer compaction from 1979 to 1995.
Originally published in:
Image of the original extensometer at Franklin, Virginia, which recorded aquifer compaction from 1979 to 1995.
Originally published in: