
The Virginia Extensometer Network
Borehole extensometers are instruments that monitor land subsidence caused by aquifer compaction. They provide precise, high-resolution measurements of changes in aquifer-system thickness. These changes in aquifer-system thickness contribute to vertical land motion (VLM) across the Virginia Coastal Plain, and are driven primarily by groundwater level decline due to human water usage.
The Virginia-West Virginia Water Science Center, with cooperation from the Virginia Department of Environmental Quality (DEQ) and the Hampton Roads Sanitation District (HRSD), has developed an expanding extensometer network on the Virginia Coastal Plain to monitor VLM induced by groundwater pumping.
The Virginia Coastal Plain region is exhibiting the highest rates of relative sea level rise on the Atlantic Coast, which is exacerbated by land subsidence. This work aims to mitigate, and potentially prevent, adverse effects associated with land subsidence in coastal settings, such as increased flood frequency/severity, acceleration of wetland loss, and damage to infrastructure, by informing policy- and decision-makers across the Virginia Coastal Plain.

Table of Contents
Extensometer Design and Construction
The Virginia Extensometer Network
- The Franklin Extensometer
- The Suffolk Extensometer
- The Nansemond Extensometer
- The West Point Extensometer
Compaction and Groundwater Level Records
Mechanisms of Land Subsidence
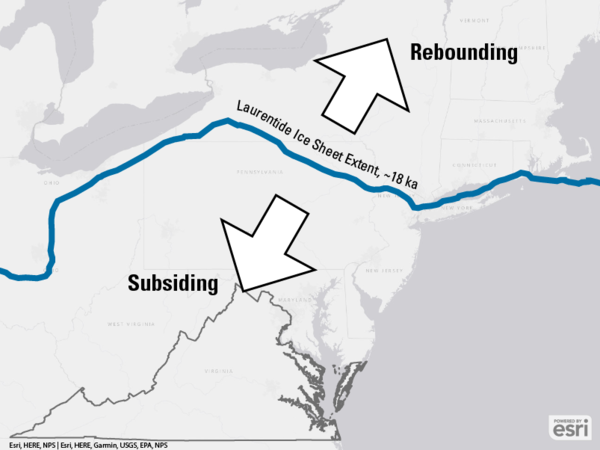
The Virginia Coastal Plain region is exhibiting the highest rates of relative sea level rise on the Atlantic Coast[1]. This is due in part to subsidence, or downward vertical land motion (VLM), in the region. VLM in the Virginia Coastal Plain is caused in part by aquifer compaction, and in part by glacial isostatic adjustment linked with forebulge collapse following retreat of the Laurentide ice sheet between ~21 and 7 thousand years ago.
Extensometers only measure VLM that occurs between the land surface and basement rock, and so can differentiate aquifer compaction and other anthropogenic drivers from subsidence that is driven by glaciotectonic factors (Figure 1). This allows researchers to identify how much subsidence is driven by groundwater use. VLM, and by extension relative sea level rise, across the Virginia Coastal Plain may be partially offset through sustainable groundwater practices. However, some portion of land subsidence is believed to be irreversible, meaning no change in water use will restore the aquifer system or land elevation to the original, pre-developmental state. To understand why, let’s discuss the main drivers of land subsidence in the region.
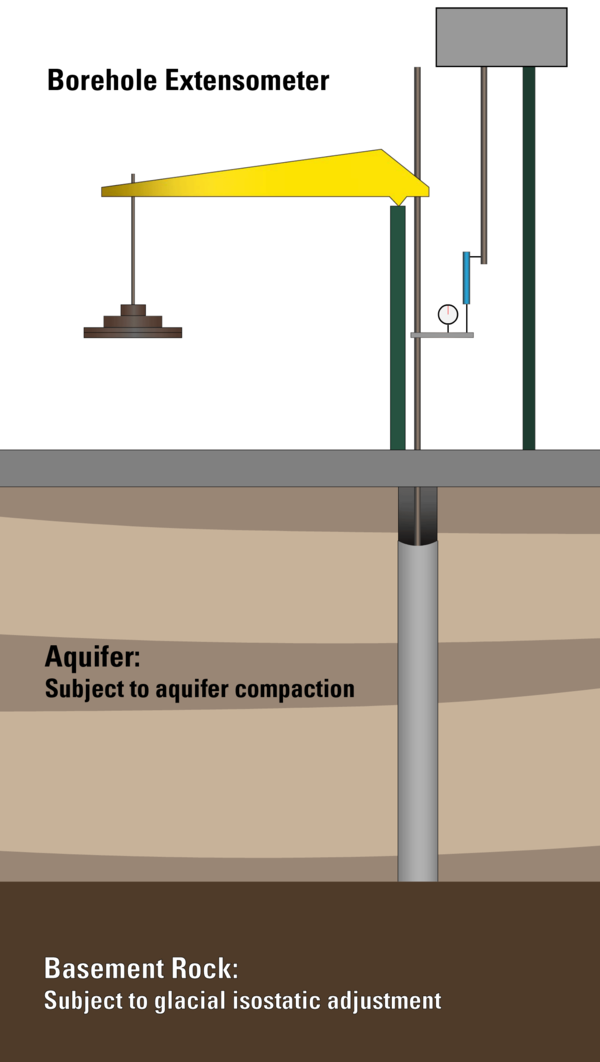


Figure 1: Extensometers measure vertical land motion caused by changes in aquifer system thickness, but not from other deep-earth geological processes. Boreholes are drilled through the entirety of an aquifer system and the steel pipe is anchored at the base to the basement rock (left). When the aquifer system compacts, this is recorded by the extensometer (center). When vertical land motion is caused by deep earth processes such as glacial isostatic adjustment, the extensometer does not record the change (right).
Glacial Isostatic Adjustment
The Virginia Coastal Plain lies south of the ancestral Laurentide ice sheet, which once covered much or North America during the Pleistocene epoch (Figures 2 & 3). Glacial Isostatic Adjustment (GIA) leads to VLM through glacial loading/unloading of the lithosphere (Figure 4). When an ice sheet forms, subsidence occurs directly beneath the ice sheet, while uplift occurs in fringe areas, or the forebulge, along the ice sheet's edge and beyond, depending on ice sheet size and lithospheric response[2]. Subsequent ice sheet melting leads to crustal unloading and forebulge collapse, causing subsidence in areas peripheral to the ice sheet like the Virginia Coastal Plain. Subsidence rates associated with GIA are estimated to be ~1 mm/yr in the Virginia Coastal Plain[3], which are far less than the total, widely observed subsidence rates in the region, which exceed 2 mm/yr and can reach up to 4.4 mm/yr[4],[5]. However, land subsidence caused by GIA cannot be stopped or controlled through human means, so it is important to understand.


Aquifer Compaction
Aquifer-system compaction is caused by sustained groundwater level decline, usually because of excessive groundwater use by humans. When an aquifer system is pumped, pore fluid pressure decreases in the aquifer, which leads to a relative increase in the effective stress caused by the weight of the overlying sediment load. Once this effective stress exceeds a certain threshold, the aquifer will compact.
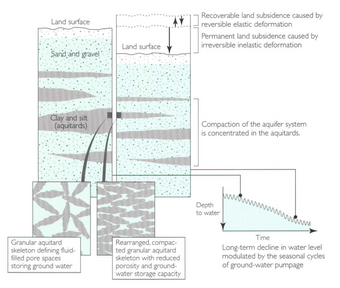
Compaction is primarily observed in confining units, or aquitard layers, composed of highly compressible fine-grained sediments, such as clay and silt. Once these fine-grained sediments are compacted, the compaction is generally irreversible[6][7]. Even raising groundwater back to historic levels will not reverse compaction of the clay aquitard layers that has already occurred[8]. This is known as inelastic deformation, or non-recoverable aquifer compaction.
Elastic deformation occurs when coarser sediments in an aquifer compact. These coarser layers are what we'd think of as the main water-transmitting layers of the aquifer. When the effective stress caused by the weight of the overlying sediments remains below the preconsolidation stress threshold, elastic deformation of these layers is reversible.[9][10] These coarse sediments are overall less compressible than clay confining layers. Given two equally thick aquifer layers, one of coarser sediments that deform elastically, and one clay aquitard that deforms inelastically, the clay aquitard could compact at least an order of magnitude more than the coarser layer.[2]
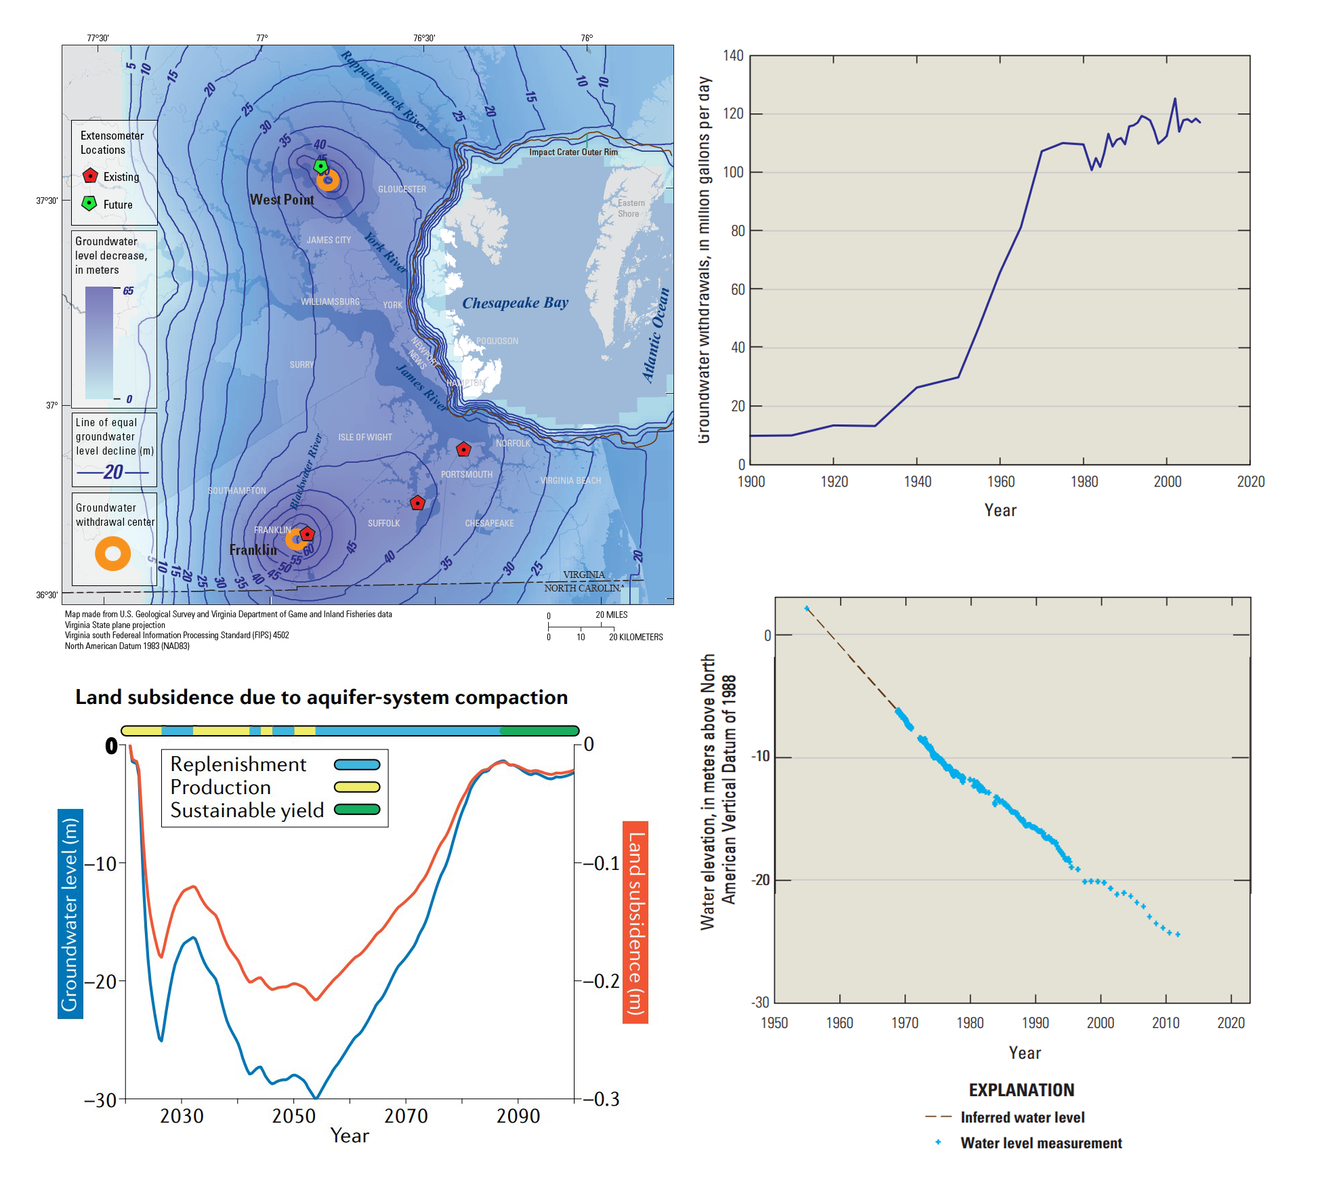
Across the Virginia Coastal Plain, the majority of land subsidence that has already occurred has been attributed to the compaction of clay confining units in the Potomac Aquifer System, primarily caused by groundwater level decline. This could ultimately limit aquifer system restoration efforts aimed at raising land surface elevation[5][8] (Figure 6). Nevertheless, changing current pumping rates can still greatly reduce land subsidence rates across the region. In order to understand exactly how such changes would affect subsidence, the aquifer system must be monitored. The development and expansion of a strategic extensometer network by the USGS and its partners, supplemented by other monitoring methods, will provide a means to directly assess how the aquifer system responds to evolving groundwater management practices. However, the effects of changes in water use may not be immediately apparent, with groundwater levels projected to continue to decline independent of potential reductions in pumping[5].
Extensometer Design and Construction
Borehole extensometers are highly sensitive instruments capable of measuring sub-millimeter changes in aquifer-system thickness at a single location. This accuracy is especially critical for measuring and distinguishing fluctuations in the aquifer system caused by both natural tides and human groundwater pumping. Extensometers measure data continuously, and can distinguish between glacial isostatic adjustment and aquifer compaction, unlike geodetic benchmark surveying techniques. Also, unlike satellite-based methods such as InSAR, extensometers are not adversely affected by humidity, non-reflective surfaces, or noise introduced by subtle undulations in the Earth's surface.[11] These advantages, however, are balanced by a major drawback: cost. Extensometers are expensive to install and buildout once a suitable location is identified.
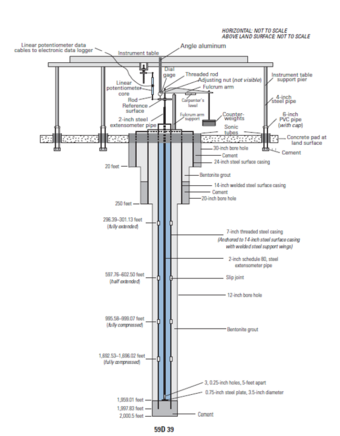
Prior to building the surface monitoring equipment, the borehole must be drilled to the target depth, which is typically to the crystalline basement rock that forms the base of the aquifer system (Figure 7). This ensures that the extensometer records changes in the total thickness of the aquifer system. In some cases, coupled extensometers[13] or spider magnets within a single borehole[12] can be used to examine differential compaction within discrete hydrogeologic units. Most boreholes will need to exceed 1000 ft. in total depth to reach basement rock in the Virginia Coastal Plain. The steel or PVC casings vary in diameter depending on depth (Figure 7) and serve to maintain borehole integrity and prevent collapse. The casings are the 'backbone' that support the 'spinal cord' that is the 2-inch steel extensometer pipe. The less the borehole deviates vertically, the less friction is caused between the extensometer pipe and the surrounding casing.
Once the borehole is drilled and the casing is set, a cement plug is installed at the very bottom of the borehole upon which the extensometer pipe will rest. The extensometer pipe, which can be hundreds to thousands of feet long, is lowered into the borehole and carefully balanced by a counterweight at the surface. The counterweight ensures that the pipe doesn't deform under its own weight, eliminates friction, and enables high-precision measurements. Slip joints at various depths form a critical part of the extensometer string by allowing the instrument to expand and contract in response to changes in aquifer-system thickness. The number and placement of slip joints depends on a many factors, including the depths of clay-rich confining units and the total compaction and/or uplift projected for the operational period.
An additional three shallow holes are drilled to install support piers for the instrument table that sits above the extensometer. This provides a stable surface from which to measure VLM, with additional benefits including the reduction of record interference by temperature/moisture fluctuations at the surface[6]. A linear potentiometer connects the instrument table to a reference surface anchored to the section of the extensometer pipe which extends above the ground surface. The surface instrumentation is housed in a shed approximately 20’x20’x10’ (Figure 8).


The Virginia Extensometer Network
The Virginia Extensometer Network, which extends across the Coastal Plain, is the result of joint efforts between the USGS Virginia-West Virginia Water Science Center and our partner organizations, namely the Virginia Department of Environmental Quality (DEQ) and the Hampton Roads Sanitation District (HRSD). Currently, three borehole extensometers are actively recording aquifer-system thickness changes across the Virginia Coastal Plain in Franklin, Suffolk, and Nansemond. A fourth extensometer is scheduled to be drilled in late 2022 at West Point, Virginia, with buildout scheduled to be completed in 2025 (Figure 6, top left). Each location was carefully selected based on number of factors, such as proximity to pumping centers or managed aquifer recharge facilities.
The Franklin Extensometer
The site at Franklin, Virginia was selected due to the large cone of depression that has developed from substantial groundwater withdrawals for municipal, industrial, and agricultural use in nearby areas (Figure 6, top left). Artesian wells penetrating the Cretaceous Potomac aquifer system ceased flowing freely in the early 1940s as groundwater withdrawals increased and water pressure fell. Withdrawals at Franklin increased sevenfold from 5 million gallons per day (gpd) in the 1940s to over 35 million gpd in the 1970s, followed by relatively gradual increases in the following decades up to 40 million gpd[6][14]. Consequently, groundwater levels near Franklin have declined significantly in the middle Potomac aquifer. This is having a profound effect on VLM regionally[6] (Figure 9).

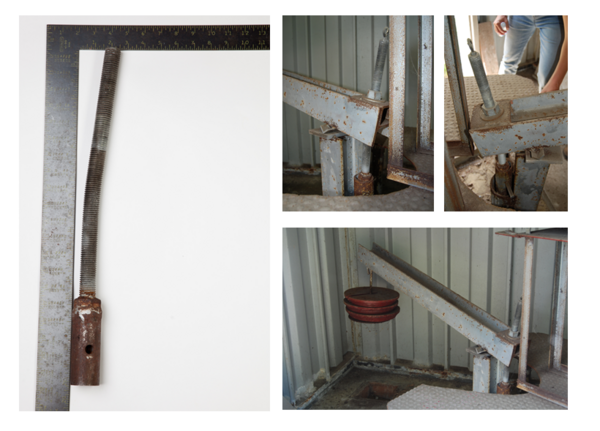
From 1979 to 1995, the Franklin extensometer recorded cumulative compaction of 24.2 mm at 1.5 mm/yr. This has been attributed to a groundwater level decline in the Potomac aquifer of ~2 m over the same period of time[5]. Active monitoring and maintenance of the Franklin extensometer was halted in 1995, with subsequent refurbishment in 2017 returning the instrument to full function. Fortunately, groundwater pumping rates went down during these 22 years. Unfortunately, the 22-year lapse in data collection resulted in a missed opportunity to document aquifer-system recovery in response to reduced pumping rates. Upon returning to the Franklin site, USGS scientists discovered a protruding, bent extensometer pipe. This is believed to be caused by uplift of the land surface at Franklin as the aquifer-system rebounded (Figure 10, Figure 11, Figure 12). This observation provides direct evidence for how sustainable groundwater use can reduce or even reverse land subsidence, and by extension relative sea level rise, on the Virginia Coastal Plain.


The Suffolk Extensometer
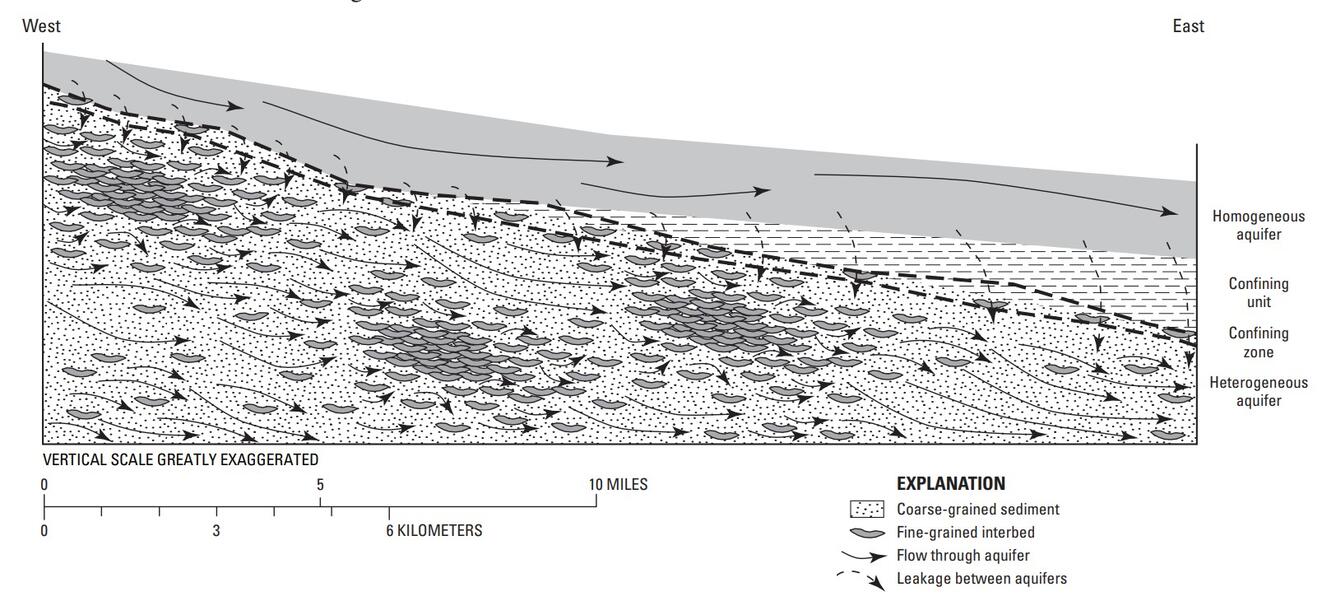
A second extensometer was installed in Suffolk, Virginia in 1982, with a period of record extending up to 1995, when it was decommissioned. Suffolk was selected as a monitoring site for similar reasons as the Franklin site. Groundwater withdrawals had increased from ~1 million gallons per day in the early 1900s to nearly 15 million gallons per day in the early 2000s. These pumping rates, combined with the proximity to Franklin, produced a ~100-foot decline in groundwater levels in the middle Potomac aquifer that induced a total of 50.2 millimeters of compaction from 1982 to 1995 at a rate of 3.7 millimeters per year[6]. Subsidence rates were higher at Suffolk relative to Franklin, even though Suffolk is further from the epicenter of groundwater drawdown in the region (Figure 6). This may be attributed to a greater cumulative thickness of clay confining units at Suffolk (130.8 m) compared to Franklin (62.7 m). This highlights how the overall thickness of clay-rich confining units, alongside groundwater levels and sediment compressibility, impacts the magnitude and rate of compaction on a local scale (Figure 5). Furthermore, the differences in compaction records between Franklin and Suffolk highlight the challenges associated with characterizing land subsidence across the Virginia Coastal Plain, where spatial and stratigraphic heterogeneities in sediment compositions are the norm[15] (Figure 13).
The Nansemond Extensometer
In 2018, a third extensometer was installed in Nansemond, Virginia. Although this location was influenced by pumping activities in Franklin and Suffolk, the primary reason to install an extensometer at Nansemond was to monitor the potential for managed aquifer recharge to restore the Potomac aquifer system. The managed aquifer recharge program is termed the Sustainable Water Initiate for Tomorrow, or SWIFT. SWIFT was first designed by HRSD to reduce nutrient runoff into the Chesapeake Bay by introducing secondary effluent from a wastewater treatment plant, treated to drinking water standards, into the Potomac aquifer. A byproduct of the SWIFT program could be an attenuation or reversal of groundwater level decline in the Potomac aquifer, which may lead to aquifer-system expansion and uplift of the land surface[16]. A scaled-down SWIFT pilot site was constructed at the HRSD Nansemond Treatment Plant and came online in May of 2018. This scaled-down version of SWIFT has a managed aquifer recharge of only ~1 million gallons per day, compared to the full scale planned facilities, which will have the potential of million gallons per day of managed aquifer recharge across its network. In August 2018, three months after the SWIFT pilot site came online, the Nansemond extensometer came online and began monitoring the site's aquifer. Efforts are currently underway to understand the impact managed aquifer recharge may have on aquifer system thickness using data recorded at the Nansemond extensometer.
The West Point Extensometer
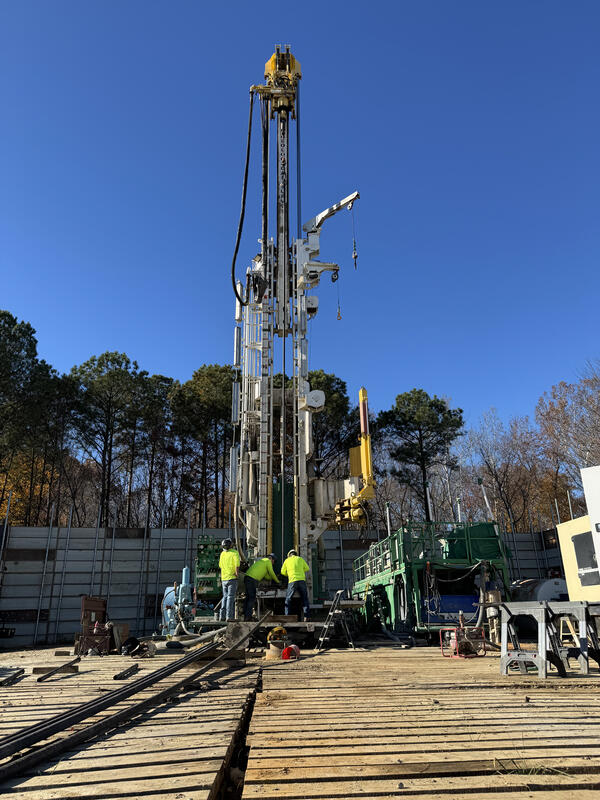
In 2022, the USGS began work on a fourth extensometer in West Point, Virginia. Drilling for this extensometer began in March of 2023. Alongside Franklin, West Point represents a region where the greatest groundwater level declines have been observed in the Potomac aquifer[17] (Figure 6). The pumping center of West Point historically extracted between 14 to 18 million gallons per day, which accounts for nearly 50% of all measured groundwater withdrawals for the Virginia Coastal Plain when combined with the Franklin pumping center[14]. Geodetic surveys recorded the highest rates of subsidence at both West Point and Franklin between the 1940s and 1970s, when pumping rates were increasing dramatically.[4] This makes West Point an ideal location for a fourth extensometer. Data collection began at West Point on December 11, 2024.

Compaction and Groundwater Level Records
In order to understand VLM, scientists must be able to compare aquifer compaction and groundwater level records at each monitored site. This is critical to both validate uncertainties surrounding the main drivers of vertical land motion in a specific area, as well as guide groundwater management strategies (Figure 6, lower left). After all, VLM on the Virginia Coastal Plain is caused by a combination of both natural and anthropogenic processes, so understanding how much subsidence is driven by human activity is key. If an extensometer measures aquifer compaction at the same time as groundwater levels are recorded dropping, this likely means that human groundwater pumping is the primary driving force behind the measured subsidence. However, if no groundwater decline is observed, then other causes must be considered (Figure 1). Other insights, such as the compressibility of the sediments in a specific location or stress-strain relationships, may be learned by examining groundwater level data and extensometer data side-by-side [11][18][21], especially through the use of one- and two-dimensional numerical models[5][19][20].
For the most recent groundwater and compaction data from our extensometers, please visit this page's data tab.
References
- Zervas, C.E., 2009, Sea level variations of the United States, 1854-2006: NOAA technical report NOS CO-OPS, 53, https://repository.library.noaa.gov/view/noaa/2565.
- Shirzaei, M., Freymueller, J., Törnqvist, T.E., Galloway, D.L., Dura, T., & Minderhoud, P.S.J., 2021, Measuring, modelling and projecting coastal land subsidence: Nature Reviews Earth & Environment, 2(1), https://doi.org/10.1038/s43017-020-00115-x
- Engelhart, S.E., Horton, B.P., Douglas, B.C., Peltier, W.R. & Törnqvist, T.E., 2009, Spatial Variability of Late Holocene and 20th Century Sea-Level Rise Along the Atlantic Coast of the United States: Geology, 37(12), https://doi.org/10.1130/G30360A.1
- Holdahl, S. R. & Morrison, N. L., 1974, Regional Investigations of Vertical Crustal Movements in the US, Using Precise Relevelings and Mareograph Data: Tectonophysics, 23(4), https://doi.org/10.1016/0040-1951(74)90073-0
- Pope, J. P., & Burbey, T. J., 2004, Multiple‐aquifer Characterization from Single Borehole Extensometer Records: Ground Water, 42(1), https://doi.org/10.1111/j.1745-6584.2004.tb02449.x.
- Pope, J. P., 2002, Characterization and modeling of land subsidence due to groundwater withdrawals from the confined aquifers of the Virginia Coastal Plain: Doctoral dissertation, Virginia Tech, https://vtechworks.lib.vt.edu/items/a26e3ed7-a75f-41cb-928b-d305ea1ceba8
- Smith, R.G., Knight, R., Reeves, J.A., Zebker, H.A., Farr, T., Liu, Z., 2017, Estimating the permanent loss of groundwater storage in the southern San Joaquin Valley, California: Water Resources Research, 53(3), https://doi.org/10.1002/2016WR019861
- Konikow, L.F. and Neuzil, C.E., 2007, A method to estimate groundwater depletion from confining layers: Water Resources Research, 43(7), https://doi.org/10.1029/2006WR005597
- Galloway, D.L. and Burbey, T.J., 2011, Regional land subsidence accompanying groundwater extraction: Hydrogeology Journal, 19(8), https://doi.org/10.1007/s10040-011-0775-5
- Terzaghi, K., 1925, Principles of soil mechanics, IV - Settlement and consolidation of clay: Eng. News Record 95
- Burbey, T. J., 2020, Extensometer forensics: what can the data really tell us?: Hydrogeology Journal, 28(2), https://doi.org/10.1007/s10040-019-02060-6
- Hung, W.C., Wang, C., Hwang, C., Chen, Y.A., Chiu, H.C., & Lin, S.H., 2015, Multiple sensors applied to monitorland subsidence in Central Taiwan: Proceedings of IAHS, 372, https://doi.org/10.5194/piahs-372-385-2015
- Metzger, L.F., Ikehara, M.E. & Howle, J.F., 2001, Vertical-deformation, water-level, microgravity, geodetic, water-chemistry, and flow-rate data collected during injection, storage, and recovery tests at Lancaster, Antelope Valley, California, September 1995 through September 1998: USGS Open-File Report 2001-414 https://doi.org/10.3133/ofr01414
- Harsh, J.F., Laczniak, R.J., 1990, Conceptualization and analysis of ground-water flow system in the Coastal Plain of Virginia and adjacent parts of Maryland and North Carolina: U.S. Geological Survey Professional Paper 1404-F, https://doi.org/10.3133/pp1404F
- McFarland, R.E., & Scott, B.T., 2006, The Virginia Coastal Plain Hydrogeologic Framework: U.S. Geological Survey Professional Paper 1731, https://doi.org/10.3133/pp1731
- Martinez, M.B., Widdowson, M.A., Bott, C., Holloway, D., Heisig‐Mitchell, J. and Wilson, C., 2022, Demonstration of Managed Aquifer Recharge in a Coastal Plain Aquifer: Lessons Learned: Groundwater, https://doi.org/10.1111/gwat.13197
- Heywood, C.E., and Pope, J.P., 2009, Simulation of groundwater flow in the Coastal Plain aquifer system of Virginia: U.S. Geological Survey Scientific Investigations Report 2009–5039, https://doi.org/10.3133/sir20095039
- Epstein, V.J., 1987, Hydrologic and geologic factors affecting land subsidence near Eloy, Arizona: U.S. Geological Survey Report 87-4143, https://doi.org/10.3133/wri874143
- Larson, K.J., Başaǧaoǧlu, H. and Marino, M.A., 2001, Prediction of optimal safe ground water yield and land subsidence in the Los Banos-Kettleman City area, California, using a calibrated numerical simulation model: Journal of hydrology, 242(1-2), https://doi.org/10.1016/S0022-1694(00)00379-6
- Calderhead, A.I., Therrien, R., Rivera, A., Martel, R. and Garfias, J., 2011, Simulating pumping-induced regional land subsidence with the use of InSAR and field data in the Toluca Valley, Mexico: Advances in Water Resources, 34(1), https://doi.org/10.1016/j.advwatres.2010.09.017
- Zhuang, C., Zhou, Z. and Illman, W.A., 2017, A joint analytic method for estimating aquitard hydraulic parameters: Groundwater, 55(4), https://doi.org/10.1111/gwat.12494
Explore other components of the Virginia Land Subsidence program.

Land Subsidence on the Virginia Coastal Plain

Progress Through Partnerships - Chesapeake Bay Vertical Land Motion Project

Hampton Roads Benchmark Monitoring Network

Virginia Coastal Plain Aquifer System and Groundwater Resources
Photos


Borehole extensometers are instruments that monitor land subsidence caused by aquifer compaction. They provide precise, high-resolution measurements of changes in aquifer-system thickness. These changes in aquifer-system thickness contribute to vertical land motion (VLM) across the Virginia Coastal Plain, and are driven primarily by groundwater level decline due to human water usage.
The Virginia-West Virginia Water Science Center, with cooperation from the Virginia Department of Environmental Quality (DEQ) and the Hampton Roads Sanitation District (HRSD), has developed an expanding extensometer network on the Virginia Coastal Plain to monitor VLM induced by groundwater pumping.
The Virginia Coastal Plain region is exhibiting the highest rates of relative sea level rise on the Atlantic Coast, which is exacerbated by land subsidence. This work aims to mitigate, and potentially prevent, adverse effects associated with land subsidence in coastal settings, such as increased flood frequency/severity, acceleration of wetland loss, and damage to infrastructure, by informing policy- and decision-makers across the Virginia Coastal Plain.
Table of Contents
Extensometer Design and Construction
The Virginia Extensometer Network
- The Franklin Extensometer
- The Suffolk Extensometer
- The Nansemond Extensometer
- The West Point Extensometer
Compaction and Groundwater Level Records
Mechanisms of Land Subsidence
The Virginia Coastal Plain region is exhibiting the highest rates of relative sea level rise on the Atlantic Coast[1]. This is due in part to subsidence, or downward vertical land motion (VLM), in the region. VLM in the Virginia Coastal Plain is caused in part by aquifer compaction, and in part by glacial isostatic adjustment linked with forebulge collapse following retreat of the Laurentide ice sheet between ~21 and 7 thousand years ago.
Extensometers only measure VLM that occurs between the land surface and basement rock, and so can differentiate aquifer compaction and other anthropogenic drivers from subsidence that is driven by glaciotectonic factors (Figure 1). This allows researchers to identify how much subsidence is driven by groundwater use. VLM, and by extension relative sea level rise, across the Virginia Coastal Plain may be partially offset through sustainable groundwater practices. However, some portion of land subsidence is believed to be irreversible, meaning no change in water use will restore the aquifer system or land elevation to the original, pre-developmental state. To understand why, let’s discuss the main drivers of land subsidence in the region.
Figure 1: Extensometers measure vertical land motion caused by changes in aquifer system thickness, but not from other deep-earth geological processes. Boreholes are drilled through the entirety of an aquifer system and the steel pipe is anchored at the base to the basement rock (left). When the aquifer system compacts, this is recorded by the extensometer (center). When vertical land motion is caused by deep earth processes such as glacial isostatic adjustment, the extensometer does not record the change (right).
Glacial Isostatic Adjustment
The Virginia Coastal Plain lies south of the ancestral Laurentide ice sheet, which once covered much or North America during the Pleistocene epoch (Figures 2 & 3). Glacial Isostatic Adjustment (GIA) leads to VLM through glacial loading/unloading of the lithosphere (Figure 4). When an ice sheet forms, subsidence occurs directly beneath the ice sheet, while uplift occurs in fringe areas, or the forebulge, along the ice sheet's edge and beyond, depending on ice sheet size and lithospheric response[2]. Subsequent ice sheet melting leads to crustal unloading and forebulge collapse, causing subsidence in areas peripheral to the ice sheet like the Virginia Coastal Plain. Subsidence rates associated with GIA are estimated to be ~1 mm/yr in the Virginia Coastal Plain[3], which are far less than the total, widely observed subsidence rates in the region, which exceed 2 mm/yr and can reach up to 4.4 mm/yr[4],[5]. However, land subsidence caused by GIA cannot be stopped or controlled through human means, so it is important to understand.
Aquifer Compaction
Aquifer-system compaction is caused by sustained groundwater level decline, usually because of excessive groundwater use by humans. When an aquifer system is pumped, pore fluid pressure decreases in the aquifer, which leads to a relative increase in the effective stress caused by the weight of the overlying sediment load. Once this effective stress exceeds a certain threshold, the aquifer will compact.
Compaction is primarily observed in confining units, or aquitard layers, composed of highly compressible fine-grained sediments, such as clay and silt. Once these fine-grained sediments are compacted, the compaction is generally irreversible[6][7]. Even raising groundwater back to historic levels will not reverse compaction of the clay aquitard layers that has already occurred[8]. This is known as inelastic deformation, or non-recoverable aquifer compaction.
Elastic deformation occurs when coarser sediments in an aquifer compact. These coarser layers are what we'd think of as the main water-transmitting layers of the aquifer. When the effective stress caused by the weight of the overlying sediments remains below the preconsolidation stress threshold, elastic deformation of these layers is reversible.[9][10] These coarse sediments are overall less compressible than clay confining layers. Given two equally thick aquifer layers, one of coarser sediments that deform elastically, and one clay aquitard that deforms inelastically, the clay aquitard could compact at least an order of magnitude more than the coarser layer.[2]
Across the Virginia Coastal Plain, the majority of land subsidence that has already occurred has been attributed to the compaction of clay confining units in the Potomac Aquifer System, primarily caused by groundwater level decline. This could ultimately limit aquifer system restoration efforts aimed at raising land surface elevation[5][8] (Figure 6). Nevertheless, changing current pumping rates can still greatly reduce land subsidence rates across the region. In order to understand exactly how such changes would affect subsidence, the aquifer system must be monitored. The development and expansion of a strategic extensometer network by the USGS and its partners, supplemented by other monitoring methods, will provide a means to directly assess how the aquifer system responds to evolving groundwater management practices. However, the effects of changes in water use may not be immediately apparent, with groundwater levels projected to continue to decline independent of potential reductions in pumping[5].
Extensometer Design and Construction
Borehole extensometers are highly sensitive instruments capable of measuring sub-millimeter changes in aquifer-system thickness at a single location. This accuracy is especially critical for measuring and distinguishing fluctuations in the aquifer system caused by both natural tides and human groundwater pumping. Extensometers measure data continuously, and can distinguish between glacial isostatic adjustment and aquifer compaction, unlike geodetic benchmark surveying techniques. Also, unlike satellite-based methods such as InSAR, extensometers are not adversely affected by humidity, non-reflective surfaces, or noise introduced by subtle undulations in the Earth's surface.[11] These advantages, however, are balanced by a major drawback: cost. Extensometers are expensive to install and buildout once a suitable location is identified.
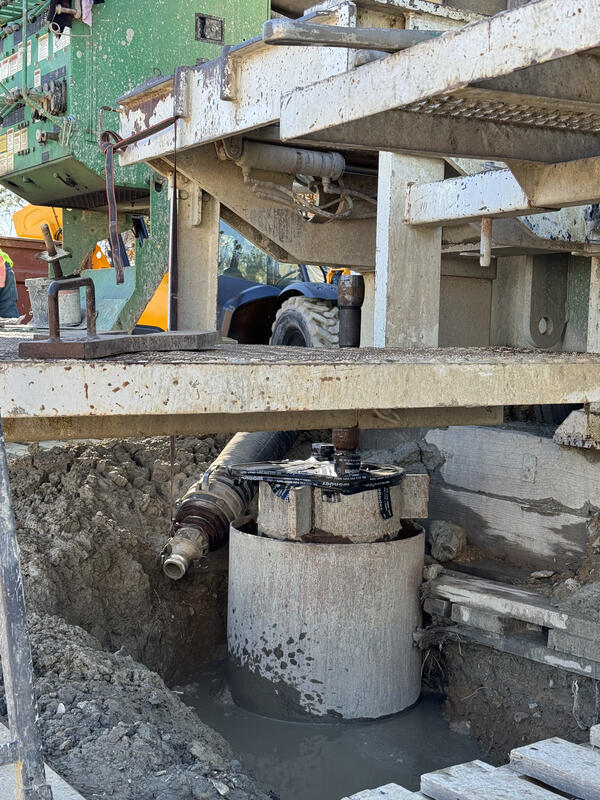
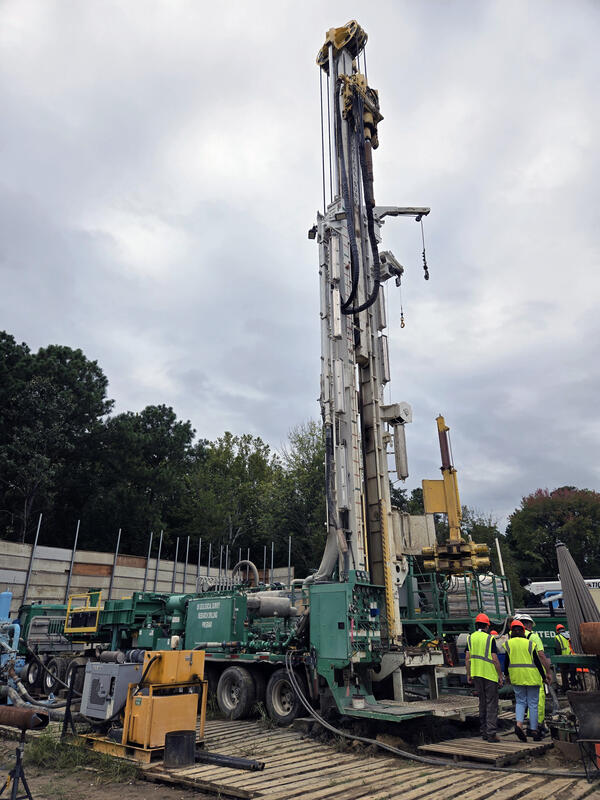
Prior to building the surface monitoring equipment, the borehole must be drilled to the target depth, which is typically to the crystalline basement rock that forms the base of the aquifer system (Figure 7). This ensures that the extensometer records changes in the total thickness of the aquifer system. In some cases, coupled extensometers[13] or spider magnets within a single borehole[12] can be used to examine differential compaction within discrete hydrogeologic units. Most boreholes will need to exceed 1000 ft. in total depth to reach basement rock in the Virginia Coastal Plain. The steel or PVC casings vary in diameter depending on depth (Figure 7) and serve to maintain borehole integrity and prevent collapse. The casings are the 'backbone' that support the 'spinal cord' that is the 2-inch steel extensometer pipe. The less the borehole deviates vertically, the less friction is caused between the extensometer pipe and the surrounding casing.
Once the borehole is drilled and the casing is set, a cement plug is installed at the very bottom of the borehole upon which the extensometer pipe will rest. The extensometer pipe, which can be hundreds to thousands of feet long, is lowered into the borehole and carefully balanced by a counterweight at the surface. The counterweight ensures that the pipe doesn't deform under its own weight, eliminates friction, and enables high-precision measurements. Slip joints at various depths form a critical part of the extensometer string by allowing the instrument to expand and contract in response to changes in aquifer-system thickness. The number and placement of slip joints depends on a many factors, including the depths of clay-rich confining units and the total compaction and/or uplift projected for the operational period.
An additional three shallow holes are drilled to install support piers for the instrument table that sits above the extensometer. This provides a stable surface from which to measure VLM, with additional benefits including the reduction of record interference by temperature/moisture fluctuations at the surface[6]. A linear potentiometer connects the instrument table to a reference surface anchored to the section of the extensometer pipe which extends above the ground surface. The surface instrumentation is housed in a shed approximately 20’x20’x10’ (Figure 8).
The Virginia Extensometer Network
The Virginia Extensometer Network, which extends across the Coastal Plain, is the result of joint efforts between the USGS Virginia-West Virginia Water Science Center and our partner organizations, namely the Virginia Department of Environmental Quality (DEQ) and the Hampton Roads Sanitation District (HRSD). Currently, three borehole extensometers are actively recording aquifer-system thickness changes across the Virginia Coastal Plain in Franklin, Suffolk, and Nansemond. A fourth extensometer is scheduled to be drilled in late 2022 at West Point, Virginia, with buildout scheduled to be completed in 2025 (Figure 6, top left). Each location was carefully selected based on number of factors, such as proximity to pumping centers or managed aquifer recharge facilities.
The Franklin Extensometer
The site at Franklin, Virginia was selected due to the large cone of depression that has developed from substantial groundwater withdrawals for municipal, industrial, and agricultural use in nearby areas (Figure 6, top left). Artesian wells penetrating the Cretaceous Potomac aquifer system ceased flowing freely in the early 1940s as groundwater withdrawals increased and water pressure fell. Withdrawals at Franklin increased sevenfold from 5 million gallons per day (gpd) in the 1940s to over 35 million gpd in the 1970s, followed by relatively gradual increases in the following decades up to 40 million gpd[6][14]. Consequently, groundwater levels near Franklin have declined significantly in the middle Potomac aquifer. This is having a profound effect on VLM regionally[6] (Figure 9).
From 1979 to 1995, the Franklin extensometer recorded cumulative compaction of 24.2 mm at 1.5 mm/yr. This has been attributed to a groundwater level decline in the Potomac aquifer of ~2 m over the same period of time[5]. Active monitoring and maintenance of the Franklin extensometer was halted in 1995, with subsequent refurbishment in 2017 returning the instrument to full function. Fortunately, groundwater pumping rates went down during these 22 years. Unfortunately, the 22-year lapse in data collection resulted in a missed opportunity to document aquifer-system recovery in response to reduced pumping rates. Upon returning to the Franklin site, USGS scientists discovered a protruding, bent extensometer pipe. This is believed to be caused by uplift of the land surface at Franklin as the aquifer-system rebounded (Figure 10, Figure 11, Figure 12). This observation provides direct evidence for how sustainable groundwater use can reduce or even reverse land subsidence, and by extension relative sea level rise, on the Virginia Coastal Plain.
The Suffolk Extensometer
A second extensometer was installed in Suffolk, Virginia in 1982, with a period of record extending up to 1995, when it was decommissioned. Suffolk was selected as a monitoring site for similar reasons as the Franklin site. Groundwater withdrawals had increased from ~1 million gallons per day in the early 1900s to nearly 15 million gallons per day in the early 2000s. These pumping rates, combined with the proximity to Franklin, produced a ~100-foot decline in groundwater levels in the middle Potomac aquifer that induced a total of 50.2 millimeters of compaction from 1982 to 1995 at a rate of 3.7 millimeters per year[6]. Subsidence rates were higher at Suffolk relative to Franklin, even though Suffolk is further from the epicenter of groundwater drawdown in the region (Figure 6). This may be attributed to a greater cumulative thickness of clay confining units at Suffolk (130.8 m) compared to Franklin (62.7 m). This highlights how the overall thickness of clay-rich confining units, alongside groundwater levels and sediment compressibility, impacts the magnitude and rate of compaction on a local scale (Figure 5). Furthermore, the differences in compaction records between Franklin and Suffolk highlight the challenges associated with characterizing land subsidence across the Virginia Coastal Plain, where spatial and stratigraphic heterogeneities in sediment compositions are the norm[15] (Figure 13).
The Nansemond Extensometer
In 2018, a third extensometer was installed in Nansemond, Virginia. Although this location was influenced by pumping activities in Franklin and Suffolk, the primary reason to install an extensometer at Nansemond was to monitor the potential for managed aquifer recharge to restore the Potomac aquifer system. The managed aquifer recharge program is termed the Sustainable Water Initiate for Tomorrow, or SWIFT. SWIFT was first designed by HRSD to reduce nutrient runoff into the Chesapeake Bay by introducing secondary effluent from a wastewater treatment plant, treated to drinking water standards, into the Potomac aquifer. A byproduct of the SWIFT program could be an attenuation or reversal of groundwater level decline in the Potomac aquifer, which may lead to aquifer-system expansion and uplift of the land surface[16]. A scaled-down SWIFT pilot site was constructed at the HRSD Nansemond Treatment Plant and came online in May of 2018. This scaled-down version of SWIFT has a managed aquifer recharge of only ~1 million gallons per day, compared to the full scale planned facilities, which will have the potential of million gallons per day of managed aquifer recharge across its network. In August 2018, three months after the SWIFT pilot site came online, the Nansemond extensometer came online and began monitoring the site's aquifer. Efforts are currently underway to understand the impact managed aquifer recharge may have on aquifer system thickness using data recorded at the Nansemond extensometer.
The West Point Extensometer
In 2022, the USGS began work on a fourth extensometer in West Point, Virginia. Drilling for this extensometer began in March of 2023. Alongside Franklin, West Point represents a region where the greatest groundwater level declines have been observed in the Potomac aquifer[17] (Figure 6). The pumping center of West Point historically extracted between 14 to 18 million gallons per day, which accounts for nearly 50% of all measured groundwater withdrawals for the Virginia Coastal Plain when combined with the Franklin pumping center[14]. Geodetic surveys recorded the highest rates of subsidence at both West Point and Franklin between the 1940s and 1970s, when pumping rates were increasing dramatically.[4] This makes West Point an ideal location for a fourth extensometer. Data collection began at West Point on December 11, 2024.
Compaction and Groundwater Level Records
In order to understand VLM, scientists must be able to compare aquifer compaction and groundwater level records at each monitored site. This is critical to both validate uncertainties surrounding the main drivers of vertical land motion in a specific area, as well as guide groundwater management strategies (Figure 6, lower left). After all, VLM on the Virginia Coastal Plain is caused by a combination of both natural and anthropogenic processes, so understanding how much subsidence is driven by human activity is key. If an extensometer measures aquifer compaction at the same time as groundwater levels are recorded dropping, this likely means that human groundwater pumping is the primary driving force behind the measured subsidence. However, if no groundwater decline is observed, then other causes must be considered (Figure 1). Other insights, such as the compressibility of the sediments in a specific location or stress-strain relationships, may be learned by examining groundwater level data and extensometer data side-by-side [11][18][21], especially through the use of one- and two-dimensional numerical models[5][19][20].
For the most recent groundwater and compaction data from our extensometers, please visit this page's data tab.
References
- Zervas, C.E., 2009, Sea level variations of the United States, 1854-2006: NOAA technical report NOS CO-OPS, 53, https://repository.library.noaa.gov/view/noaa/2565.
- Shirzaei, M., Freymueller, J., Törnqvist, T.E., Galloway, D.L., Dura, T., & Minderhoud, P.S.J., 2021, Measuring, modelling and projecting coastal land subsidence: Nature Reviews Earth & Environment, 2(1), https://doi.org/10.1038/s43017-020-00115-x
- Engelhart, S.E., Horton, B.P., Douglas, B.C., Peltier, W.R. & Törnqvist, T.E., 2009, Spatial Variability of Late Holocene and 20th Century Sea-Level Rise Along the Atlantic Coast of the United States: Geology, 37(12), https://doi.org/10.1130/G30360A.1
- Holdahl, S. R. & Morrison, N. L., 1974, Regional Investigations of Vertical Crustal Movements in the US, Using Precise Relevelings and Mareograph Data: Tectonophysics, 23(4), https://doi.org/10.1016/0040-1951(74)90073-0
- Pope, J. P., & Burbey, T. J., 2004, Multiple‐aquifer Characterization from Single Borehole Extensometer Records: Ground Water, 42(1), https://doi.org/10.1111/j.1745-6584.2004.tb02449.x.
- Pope, J. P., 2002, Characterization and modeling of land subsidence due to groundwater withdrawals from the confined aquifers of the Virginia Coastal Plain: Doctoral dissertation, Virginia Tech, https://vtechworks.lib.vt.edu/items/a26e3ed7-a75f-41cb-928b-d305ea1ceba8
- Smith, R.G., Knight, R., Reeves, J.A., Zebker, H.A., Farr, T., Liu, Z., 2017, Estimating the permanent loss of groundwater storage in the southern San Joaquin Valley, California: Water Resources Research, 53(3), https://doi.org/10.1002/2016WR019861
- Konikow, L.F. and Neuzil, C.E., 2007, A method to estimate groundwater depletion from confining layers: Water Resources Research, 43(7), https://doi.org/10.1029/2006WR005597
- Galloway, D.L. and Burbey, T.J., 2011, Regional land subsidence accompanying groundwater extraction: Hydrogeology Journal, 19(8), https://doi.org/10.1007/s10040-011-0775-5
- Terzaghi, K., 1925, Principles of soil mechanics, IV - Settlement and consolidation of clay: Eng. News Record 95
- Burbey, T. J., 2020, Extensometer forensics: what can the data really tell us?: Hydrogeology Journal, 28(2), https://doi.org/10.1007/s10040-019-02060-6
- Hung, W.C., Wang, C., Hwang, C., Chen, Y.A., Chiu, H.C., & Lin, S.H., 2015, Multiple sensors applied to monitorland subsidence in Central Taiwan: Proceedings of IAHS, 372, https://doi.org/10.5194/piahs-372-385-2015
- Metzger, L.F., Ikehara, M.E. & Howle, J.F., 2001, Vertical-deformation, water-level, microgravity, geodetic, water-chemistry, and flow-rate data collected during injection, storage, and recovery tests at Lancaster, Antelope Valley, California, September 1995 through September 1998: USGS Open-File Report 2001-414 https://doi.org/10.3133/ofr01414
- Harsh, J.F., Laczniak, R.J., 1990, Conceptualization and analysis of ground-water flow system in the Coastal Plain of Virginia and adjacent parts of Maryland and North Carolina: U.S. Geological Survey Professional Paper 1404-F, https://doi.org/10.3133/pp1404F
- McFarland, R.E., & Scott, B.T., 2006, The Virginia Coastal Plain Hydrogeologic Framework: U.S. Geological Survey Professional Paper 1731, https://doi.org/10.3133/pp1731
- Martinez, M.B., Widdowson, M.A., Bott, C., Holloway, D., Heisig‐Mitchell, J. and Wilson, C., 2022, Demonstration of Managed Aquifer Recharge in a Coastal Plain Aquifer: Lessons Learned: Groundwater, https://doi.org/10.1111/gwat.13197
- Heywood, C.E., and Pope, J.P., 2009, Simulation of groundwater flow in the Coastal Plain aquifer system of Virginia: U.S. Geological Survey Scientific Investigations Report 2009–5039, https://doi.org/10.3133/sir20095039
- Epstein, V.J., 1987, Hydrologic and geologic factors affecting land subsidence near Eloy, Arizona: U.S. Geological Survey Report 87-4143, https://doi.org/10.3133/wri874143
- Larson, K.J., Başaǧaoǧlu, H. and Marino, M.A., 2001, Prediction of optimal safe ground water yield and land subsidence in the Los Banos-Kettleman City area, California, using a calibrated numerical simulation model: Journal of hydrology, 242(1-2), https://doi.org/10.1016/S0022-1694(00)00379-6
- Calderhead, A.I., Therrien, R., Rivera, A., Martel, R. and Garfias, J., 2011, Simulating pumping-induced regional land subsidence with the use of InSAR and field data in the Toluca Valley, Mexico: Advances in Water Resources, 34(1), https://doi.org/10.1016/j.advwatres.2010.09.017
- Zhuang, C., Zhou, Z. and Illman, W.A., 2017, A joint analytic method for estimating aquitard hydraulic parameters: Groundwater, 55(4), https://doi.org/10.1111/gwat.12494
Explore other components of the Virginia Land Subsidence program.
Land Subsidence on the Virginia Coastal Plain
Progress Through Partnerships - Chesapeake Bay Vertical Land Motion Project
Hampton Roads Benchmark Monitoring Network