U.S. flag

An official website of the United States government

Images

Images related to natural hazards.

Filter Total Items: 7275
hurricanes and tropical storms in 9.15.2020 NOAA satellite image
USGS Scientists Work on Four Tropical Cyclones at Once

In this NOAA satellite image from Sept. 15, 2020, Hurricane Sally approaches the U.S. Gulf Coast, Hurricane Paulettte creates storm waves far out in the Atlantic, and Tropical Storms Teddy and Vicky lie near the coast of Africa. Two tropical depressions are also developing; one of them is not visible in this image.

In this NOAA satellite image from Sept. 15, 2020, Hurricane Sally approaches the U.S. Gulf Coast, Hurricane Paulettte creates storm waves far out in the Atlantic, and Tropical Storms Teddy and Vicky lie near the coast of Africa. Two tropical depressions are also developing; one of them is not visible in this image.

image related to volcanoes. See description
Underneath Kīlauea's new landscape, the magma plumbing keeps working

View of the 2018 Kīlauea caldera collapse structures from Kīlauea Overlook within Hawai‘i Volcanoes National Park. USGS photo by K. Mulliken on Sept. 2, 2020.

image related to volcanoes. See description
Geodesy through time: a history of measuring the shape of Hawaiian volcanoes

Hawaiian Volcano Observatory (HVO) Global Positioning System (GPS) survey near the coast in Hawai‘i Volcanoes National Park on September 10, 2019 (USGS photo by P. Dotray).

A screenshot of the Coastal Change Hazards Portal for Hurricane Laura showing red lines on gulf coast where change is likely.
Coastal Change Hazards Portal for Hurricane Laura

This Coastal Change Storm Hazard Team forecast was made at 4 AM CDT August 26, 2020 and shows forecast beach erosion at the base of the dunes (the strip of colored bars closest to the coast), overwash (middle strip) and inundation (outer strip) from Hurricane Laura.  The model accounts for sandy beaches and barrier islands and does not include marshes,

This Coastal Change Storm Hazard Team forecast was made at 4 AM CDT August 26, 2020 and shows forecast beach erosion at the base of the dunes (the strip of colored bars closest to the coast), overwash (middle strip) and inundation (outer strip) from Hurricane Laura.  The model accounts for sandy beaches and barrier islands and does not include marshes,

image related to volcanoes. See description
Doppler radar in Ka‘ū: more than a weather radar

Radar image of the May 17, 2018 eruption of ash from Halema‘uma‘u Crater. This image is a slice through the cloud at an altitude of 14,000 ft (4 km) above sea level at 4:12 a.m., HST. The colors scale is radar reflectivity, a measure of the size of the particles and their concentration within the ash cloud.

Radar image of the May 17, 2018 eruption of ash from Halema‘uma‘u Crater. This image is a slice through the cloud at an altitude of 14,000 ft (4 km) above sea level at 4:12 a.m., HST. The colors scale is radar reflectivity, a measure of the size of the particles and their concentration within the ash cloud.

image related to volcanoes. See description
Doppler radar in Ka‘ū: more than a weather radar

Nā‘ālehu radome, 39 ft (about 12 m) in diameter. The radar dish inside is 28 ft (8.5 m) across. USGS photo by C. Neal on July 27, 2019.

Nā‘ālehu radome, 39 ft (about 12 m) in diameter. The radar dish inside is 28 ft (8.5 m) across. USGS photo by C. Neal on July 27, 2019.

A cross-section illustration that shows the features of a subduction zone where oceanic and continental plates collide.
Subduction zone schematic
A map shows relief of a long stretch of continental margin with features on land and in the ocean labeled with lines and words.
Cascadia megathrust fault map

Topo-bathymetric map of the Cascadia subduction zone. Cascadia megathrust fault (white line); approximate shelf break along 200-m isobath (yellow line); MTJ, Mendocino triple junction.

Topo-bathymetric map of the Cascadia subduction zone. Cascadia megathrust fault (white line); approximate shelf break along 200-m isobath (yellow line); MTJ, Mendocino triple junction.

Map illustration of the seafloor off the continental coastline shows all of the regions and tracklines of recent fieldwork.
Cascadia fieldwork map

Index map of U.S. Cascadia margin showing where data have been collected since 2018 as part of the Subduction Zone Marine Geohazards Project. Details of each survey effort are provided on the Cascadia Subduction Zone Marine Geohazards project web site.

Index map of U.S. Cascadia margin showing where data have been collected since 2018 as part of the Subduction Zone Marine Geohazards Project. Details of each survey effort are provided on the Cascadia Subduction Zone Marine Geohazards project web site.

image related to volcanoes. See description
Water was in Kīlauea caldera before the 2018 summit collapse

Black streak on caldera wall (center) is about 50 m (yards) long, and white steam plume (lower right) rises from northwestern part of Halema‘uma‘u. Photo from Volcano House Hotel on July 4, 2018. The configuration of this area changed considerably after the photo was taken, as collapse continued into early August. USGS photo.

Black streak on caldera wall (center) is about 50 m (yards) long, and white steam plume (lower right) rises from northwestern part of Halema‘uma‘u. Photo from Volcano House Hotel on July 4, 2018. The configuration of this area changed considerably after the photo was taken, as collapse continued into early August. USGS photo.

image related to volcanoes. See description
Rainbow over Halema‘uma‘u and the water lake

The KWcam webcam at Kīlauea's summit captured a rainbow over the water lake in Halema‘uma‘u this afternoon, as light mist moved across the caldera.

The KWcam webcam at Kīlauea's summit captured a rainbow over the water lake in Halema‘uma‘u this afternoon, as light mist moved across the caldera.

Image shows a USGS scientist in safety equipment standing on a bridge measuring floodwaters from Hurricane Isaias
Measuring streamflow on Rock Creek after Hurricane Isaias

Fisseha Mengistu, USGS hydrologic technician, uses a device that lowers a water sampler into the creek below to collect samples used for water quality testing. Experts will be able to use this data to track how Tropical Storm Isaias impacted water quality in the area. This work was done on Rock Creek in Washington, D.C.

Fisseha Mengistu, USGS hydrologic technician, uses a device that lowers a water sampler into the creek below to collect samples used for water quality testing. Experts will be able to use this data to track how Tropical Storm Isaias impacted water quality in the area. This work was done on Rock Creek in Washington, D.C.

Monitoring for volcanic gases at Newberry Volcano
A MultiGAS instrument measures gases at Newberry Volcano

Scientists use a MultiGAS instrument (gray, hard-shell case) to measure gas compositions from the East Lake hot spring in the Newberry caldera. The photo was taken on August 3, 2020 just after sunrise. The vapor above the hot spring and lake is typical for cool mornings and is not visible later in the day.

Scientists use a MultiGAS instrument (gray, hard-shell case) to measure gas compositions from the East Lake hot spring in the Newberry caldera. The photo was taken on August 3, 2020 just after sunrise. The vapor above the hot spring and lake is typical for cool mornings and is not visible later in the day.

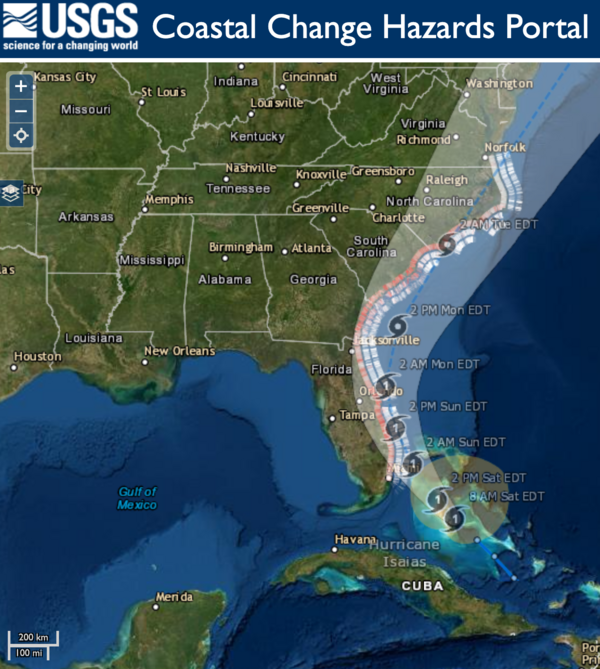
Hurricane Isaias coastal change forecast map 8.1.2020
Hurricane Isaias Unlikely to Cause Widespread Atlantic Beach Erosion

USGS coastal change experts predict that storm waves kicked up by the Category 1 hurricane are likely to cause some erosion at the base of the dunes along about 11 percent of coastal beaches between Florida and Virginia.

image related to volcanoes. See description
Timelapse showing typical activity at Kīlauea's summit water lake

This timelapse video at Kīlauea's summit covers approximately 30 minutes and shows the dynamic nature of the water lake in Halema‘uma‘u crater. Steam from the hot water surface is constantly shifting in the winds, while the migrating color boundaries on the water surface appear to show circulation in the lake. USGS video by M. Patrick.

This timelapse video at Kīlauea's summit covers approximately 30 minutes and shows the dynamic nature of the water lake in Halema‘uma‘u crater. Steam from the hot water surface is constantly shifting in the winds, while the migrating color boundaries on the water surface appear to show circulation in the lake. USGS video by M. Patrick.

image related to volcanoes. See description
Kīlauea Volcano's summit water lake is one-year old

Plot showing rise of Kīlauea's summit crater lake over the past year, during which laser rangefinder measurements of lake level were made 2–3 times per week. Photos compare the lake on August 27, 2019, when it was ~22 ft (7 m) deep, to July 7, 2020, when it was ~130 ft (40 m) deep. USGS photos.

Plot showing rise of Kīlauea's summit crater lake over the past year, during which laser rangefinder measurements of lake level were made 2–3 times per week. Photos compare the lake on August 27, 2019, when it was ~22 ft (7 m) deep, to July 7, 2020, when it was ~130 ft (40 m) deep. USGS photos.

image related to volcanoes. See description
Continued slow rise of water in Halema‘uma‘u

Kīlauea's summit water lake, in Halema‘uma‘u, continues to slowly rise. Today, the lake colors were vibrant, with a zone of aquamarine water in the west end (lower right in photo). These greenish zones tend to be slightly hotter, and appear to be zones of water influx. USGS photo by M. Patrick.

Kīlauea's summit water lake, in Halema‘uma‘u, continues to slowly rise. Today, the lake colors were vibrant, with a zone of aquamarine water in the west end (lower right in photo). These greenish zones tend to be slightly hotter, and appear to be zones of water influx. USGS photo by M. Patrick.

jezero
Jezero crater, Mars
Jezero crater, Mars
Jezero crater, Mars

Description: This is a high-resolution oblique view of the northeastern edge of the delta deposit in Jezero crater, the landing site for the Perseverance Mars rover. In the foreground, buttes of delta material stand above the crater floor. On the left and in the middle of this image, the layered rocks of the delta deposit are visible.

Description: This is a high-resolution oblique view of the northeastern edge of the delta deposit in Jezero crater, the landing site for the Perseverance Mars rover. In the foreground, buttes of delta material stand above the crater floor. On the left and in the middle of this image, the layered rocks of the delta deposit are visible.

Was this page helpful?