Brief aerial overview of activity at the flow front
Brief aerial overview of activity at the flow frontPreview image for video: provides a brief aerial overview of activity at the flow front.
An official website of the United States government
Here's how you know
Official websites use .gov
A .gov website belongs to an official government organization in the United States.
Secure .gov websites use HTTPS
A lock () or https:// means you’ve safely connected to the .gov website. Share sensitive information only on official, secure websites.
Images related to natural hazards.
Preview image for video: provides a brief aerial overview of activity at the flow front.
A closer look at the flow front, showing the leading edge moving through thick vegetation.
Another view of the flow front, looking downslope towards Pāhoa. The smoke plumes are created by individual breakouts burning vegetation at the flow margin.
This map uses a satellite image acquired in March 2014 (provided by Digital Globe) as a base to show the area around the front of the June 27th lava flow. The area of the flow on October 15, 2014, at 10:30 AM is shown in pink, while widening and advancement of the flow as mapped on October 17 at 7:40 AM is shown in red.
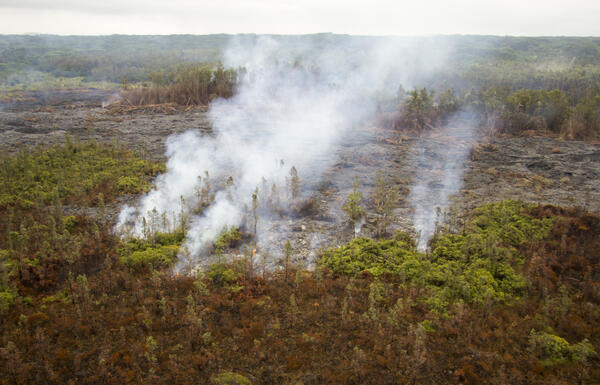
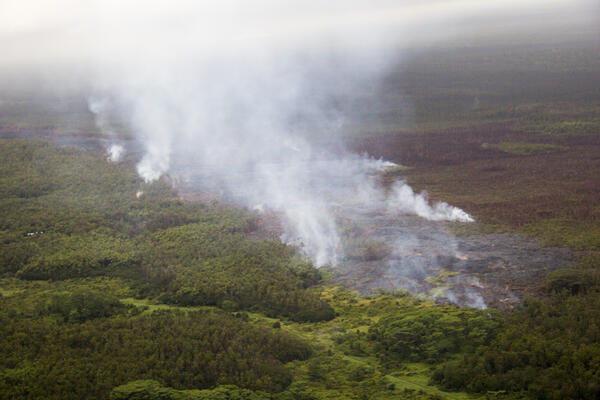
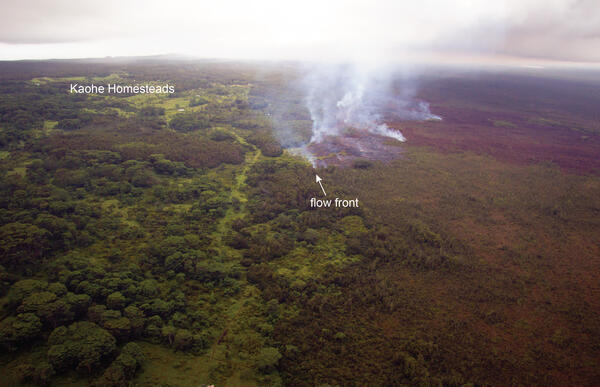
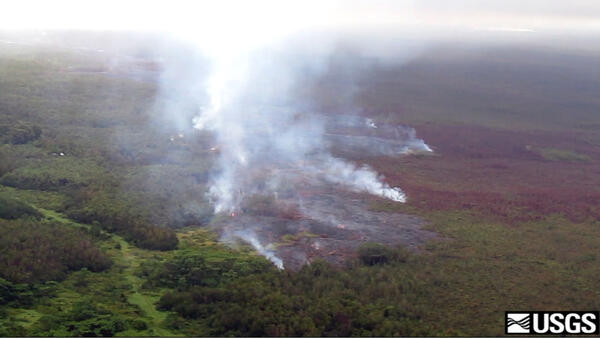
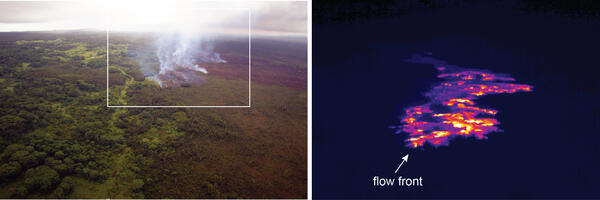
A comparison of a normal photograph of the flow front with a thermal image. The white box shows the extent of the thermal image. The thermal image shows that numerous active breakouts (white and yellow areas) are scattered behind the flow front.
USGS employee installing sensor bracket for Sandy Theme 3 (SWaTH), Assateague Island at the Maryland Virginia State Line.
NPS employee operating GPS to establish elevation on sensor bracket for Sandy Theme 3 (SWaTH), Assateague Island at the Maryland Virginia State Line.
The June 27th lava flow advancement has slowed, with the leading edge of the flow moving only a few tens of meters (yards) over the past two days. Nevertheless, active breakouts persist around the flow front, as shown in this photo by the continued burning of vegetation along the flow margins.
A closer view of the leading edge of the flow, which consisted of scattered breakouts along the flow margin that were slowly moving through thick vegetation.
Although the advancement of the leading edge of the June 27th flow has been minor over the past two days, a view into a skylight on the lava tube today showed that lava in the tube was still swiftly moving downslope towards the flow front.
This map uses a satellite image acquired in March 2014 (provided by Digital Globe) as a base to show the area around the front of the June 27th lava flow. The area of the flow on October 13, 2014, at 9:30 AM is shown in pink, while widening and advancement of the flow as mapped on October 15 at 10:30 AM is shown in red.
A wider view of the flow front from the north. The transfer station on Apa‘a St. is at the left edge of the photo, and Pu‘u ‘Ō‘ō can be seen on the horizon in the upper right.
This large-scale map shows the distal part of the June 27th flow in relation to nearby Puna communities. The area of the flow on October 13, 2014, at 9:30 AM is shown in pink, while widening and advancement of the flow as mapped on October 15 at 10:30 AM is shown in red.
This small-scale map shows the June 27th lava flow in Kīlauea's East Rift Zone in relation to lower Puna. The area of the flow on October 13, 2014, at 9:30 AM is shown in pink, while widening and advancement of the flow as mapped on October 15 at 10:30 AM is shown in red.
A normal photograph along with a thermal image of the flow front. The white box shows the approximate extent of the thermal image. The thermal image clearly shows the distribution of active breakouts (white and yellow areas), which are scattered at the leading edge of the flow but are also present up to about 1.8 km (1.1 miles) behind the flow front.
Pu‘u ‘Ō‘ō Crater remains filled with thick fume, and activity in the crater has not changed significantly over the past week. In the lower portion of the photograph, a line of fume sources marks the path of the June 27th lava tube. The broad circular feature in the left portion of the photograph is the perched lava pond that was active in July.
A wider view of the flow front, looking upslope. Kaohe Homesteads is in the left portion of the image, and Pu‘u ‘Ō‘ō can be seen on the horizon.
This large-scale map shows the distal part of the June 27th flow in relation to nearby Puna communities. The area of the flow on October 10, 2014, at 10:30 AM is shown in pink, while widening and advancement of the flow as mapped on October 13 at 9:30 AM is shown in red.
This map uses a satellite image acquired in March 2014 (provided by Digital Globe) as a base to show the area around the front of the June 27th lava flow. The area of the flow on October 10, 2014, at 10:30 AM is shown in pink, while widening and advancement of the flow as mapped on October 13 at 9:30 AM is shown in red.
The flow front remains active, with continued slow advancement towards the northeast over the weekend. The flow front today was 1.1 km (0.7 miles) upslope from Apa‘a St. and 2.2 km (1.4 miles) from Pāhoa Village Road, as measured along a straight line.
A view of the flow front from a normal camera (left) as well as from a thermal camera (right). The white box shows the extent of the thermal image. The thermal image shows that breakouts are active at the leading tip of the flow, and are also scattered upslope from the flow front.