
During hurricanes the USGS deploys storm-surge monitoring instruments along the coasts, sounds, and bays in impacted areas to gauge how high hurricanes push water in rivers, bays and other areas. The sensors are crucial for forecasting future storms and assessing hurricane damage.
Images
Images related to natural hazards.
Filter Total Items: 7275

Storm Surge Sensor During Hurricane Irene
During hurricanes the USGS deploys storm-surge monitoring instruments along the coasts, sounds, and bays in impacted areas to gauge how high hurricanes push water in rivers, bays and other areas. The sensors are crucial for forecasting future storms and assessing hurricane damage.
During hurricanes the USGS deploys storm-surge monitoring instruments along the coasts, sounds, and bays in impacted areas to gauge how high hurricanes push water in rivers, bays and other areas. The sensors are crucial for forecasting future storms and assessing hurricane damage.

Documenting Deployment of Hurricane Irene Storm Surge Sensor
Documenting Deployment of Hurricane Irene Storm Surge SensorJohn Erbland, Hydrologic Technician with the USGS South Carolina Water Science Center, holds a white board with information on the Hurricane Irene storm surge sensor deployment on a pier by the U.S. Coast Guard Station in the town of Wrightsville Beach.

Trees Killed by the 2011 Las Conchas Fire in New Mexico
Trees Killed by the 2011 Las Conchas Fire in New MexicoExtensive, contiguous mortality of piñon pine, ponderosa pine, and Douglas-fir trees, killed in the first afternoon and evening of the 2011 Las Conchas Fire in the Jemez Mountains, New Mexico. Forest drought stress is highly correlated with mortality from poor growth, bark beetle outbreaks, and high-severity fire.

Electronics shelter on Flood-Alert Instrument Tower
Electronics shelter on Flood-Alert Instrument TowerElectronics inside the instrument shelter, which includes a high-data-rate transmitter (upper right) and line-of-sight receiver (middle left). The line-of-sight receiver picks up transmissions from the remote rain gage at the look-out area at the top of the Montezuma Pass, Arizona.

Flood-Alert Instrument Tower
Flood-alert instrument tower with electronics shelter and precipitation gage at top of tower.
Flood-alert instrument tower with electronics shelter and precipitation gage at top of tower.

Stream channel cross-section measurements—instrument that uses lase...
Stream channel cross-section measurements—instrument that uses lase...Stream channel cross-section measurements—instrument that uses laser pulses to survey distance to a reflector operated by a second crew member, Mount St. Helens.
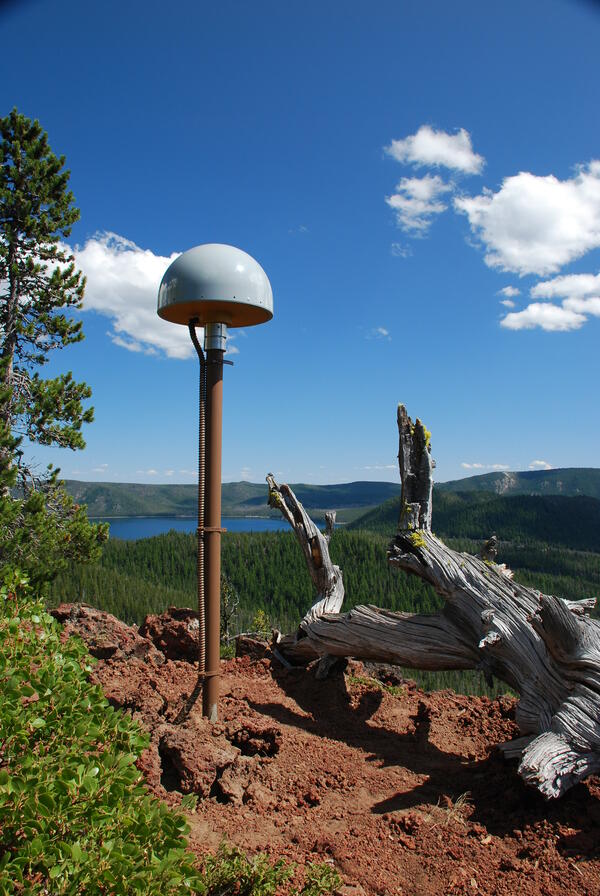
Global Positioning System receiver (called a GPS monument) at North...
Global Positioning System receiver (called a GPS monument) at North...Global Positioning System receiver (called a GPS monument) at North Rim Station, a monitoring location at Newberry volcano, Oregon.
Global Positioning System receiver (called a GPS monument) at North...
Global Positioning System receiver (called a GPS monument) at North...Global Positioning System receiver (called a GPS monument) at North Rim Station, a monitoring location at Newberry volcano, Oregon.

Hurricane Irene Makes Landfall
Upper aerial photograph shows Rodanthe, NC, looking south along the coast on August 30, 2011, three days after landfall of Hurricane Irene. The central and lower aerial photographs show pre-storm and post-storm extreme coastal change, with the yellow arrow in all 3 photographs pointing to the same cottage.
Upper aerial photograph shows Rodanthe, NC, looking south along the coast on August 30, 2011, three days after landfall of Hurricane Irene. The central and lower aerial photographs show pre-storm and post-storm extreme coastal change, with the yellow arrow in all 3 photographs pointing to the same cottage.

Vents on the west flank of Pu‘u ‘Ō‘ō erupt—once again
Vents on the west flank of Pu‘u ‘Ō‘ō erupt—once againAugust 3 photo showing the collapsed floor within Pu‘u ‘Ō‘ō Crater in the foreground and two lava flow branches each burning some forest—northwest branch to the right and south branch to the left.

Damage to Washington National Cathedral
Damage to the Washington National Cathedral in DC from the earthquake in Virginia on August 23, 2011.
Damage to the Washington National Cathedral in DC from the earthquake in Virginia on August 23, 2011.

Damage to Washington National Cathedral
Damage to the Washington National Cathedral in DC from the earthquake in Virginia on August 23, 2011.
Damage to the Washington National Cathedral in DC from the earthquake in Virginia on August 23, 2011.

HVO's first report in 1911—all about the Halema‘uma‘u lava lake
HVO's first report in 1911—all about the Halema‘uma‘u lava lakeFrank Perret's photos from early July 1911 showing the island in the lake at the bottom of a smaller Halema‘uma‘u Crater. The view is looking southwest and the ledge up near the west rim was known as the January 1910 bench, a remnant of an earlier lava level in the crater.

Electronics for controlling the moving arm
Electronics for controlling the moving arm in the open pressure housing.
Electronics for controlling the moving arm in the open pressure housing.

Mud and Peat Deposits from Point Reyes Marsh
Photograph of cutbank outcrop at Home Bay marsh, showing the subsurface stratigraphy to 90-cm depth exposed during low tide. Holes about halfway down the exposure are from burrowing crabs populating a narrow zone at the transition from underlying inorganic mud deposits to overlying peaty mud to peat deposits.
Photograph of cutbank outcrop at Home Bay marsh, showing the subsurface stratigraphy to 90-cm depth exposed during low tide. Holes about halfway down the exposure are from burrowing crabs populating a narrow zone at the transition from underlying inorganic mud deposits to overlying peaty mud to peat deposits.

Gas sampling in Sherman Crater, Mount Baker, WA. Panoramic photogra...
Gas sampling in Sherman Crater, Mount Baker, WA. Panoramic photogra...Gas sampling in Sherman Crater, Mount Baker, Washington. Panoramic photograph with USGS scientist in center-left of photo beneath fumarole.
Gas sampling in Sherman Crater, Mount Baker, WA. Panoramic photogra...
Gas sampling in Sherman Crater, Mount Baker, WA. Panoramic photogra...Gas sampling in Sherman Crater, Mount Baker, Washington. Panoramic photograph with USGS scientist in center-left of photo beneath fumarole.

Enthusiastic students during a Mount Rainier Teacher Workshop, WA.
Enthusiastic students during a Mount Rainier Teacher Workshop, WA.Enthusiastic students during a Mount Rainier Teacher Workshop, Washington.
Enthusiastic students during a Mount Rainier Teacher Workshop, WA.
Enthusiastic students during a Mount Rainier Teacher Workshop, WA.Enthusiastic students during a Mount Rainier Teacher Workshop, Washington.

USGS CVO staff member assisting a teacher with mineral identificati...
USGS CVO staff member assisting a teacher with mineral identificati...USGS CVO staff member assisting a teacher with mineral identification during July 2011 Mount Rainer Teacher Workshop.
USGS CVO staff member assisting a teacher with mineral identificati...
USGS CVO staff member assisting a teacher with mineral identificati...USGS CVO staff member assisting a teacher with mineral identification during July 2011 Mount Rainer Teacher Workshop.

A Scroll down to photo taken on June 29 to compare the amount of up...
A Scroll down to photo taken on June 29 to compare the amount of up...A Scroll down to the photo taken on June 29 to compare the amount of uplift the floor of the crater has endured in the last month. This photo was taken from a similar spot to the lower right of the three photos posted that day.