



This thermal map shows the fissure system and lava flows as of 5:30 pm on Friday, June 1. The flow from Fissure 8 continues to advance in a northeast direction and the front was roughly 9.5 km (5.9 miles) from the vent at Fissure 8. The black and white area is the extent of the thermal map.
Images
Images related to natural hazards.
Filter Total Items: 7278

Thermal map of fissure system and lava flows
This thermal map shows the fissure system and lava flows as of 5:30 pm on Friday, June 1. The flow from Fissure 8 continues to advance in a northeast direction and the front was roughly 9.5 km (5.9 miles) from the vent at Fissure 8. The black and white area is the extent of the thermal map.

Thermal map of fissure system and lava flows
This thermal map shows the fissure system and lava flows as of 6:45 am on Saturday, June 2. The flow from Fissure 8 continues to advance in a northeast direction and the front was roughly 10.1 km (6.3 miles) from the vent at Fissure 8. The black and white area is the extent of the thermal map.
This thermal map shows the fissure system and lava flows as of 6:45 am on Saturday, June 2. The flow from Fissure 8 continues to advance in a northeast direction and the front was roughly 10.1 km (6.3 miles) from the vent at Fissure 8. The black and white area is the extent of the thermal map.
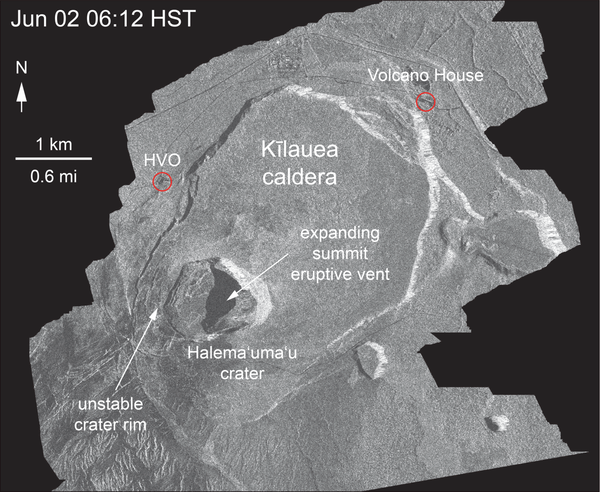
Slumping of west rim of Halema‘uma‘u
This animated GIF shows a sequence of radar amplitude images that were acquired by the Italian Space Agency's Cosmo-SkyMed satellite system. The images illustrate changes to the caldera area of Kīlauea Volcano that occurred between May 5 and June 2 at 6:00 p.m. HST.
This animated GIF shows a sequence of radar amplitude images that were acquired by the Italian Space Agency's Cosmo-SkyMed satellite system. The images illustrate changes to the caldera area of Kīlauea Volcano that occurred between May 5 and June 2 at 6:00 p.m. HST.

Kīlauea LERZ lava flows and fissures, June 3, 11:00 a.m.
Kīlauea LERZ lava flows and fissures, June 3, 11:00 a.m.Map as of 11:00 a.m. HST, June 3, 2018. Given the dynamic nature of Kīlauea's lower East Rift Zone eruption, with changing vent locations, fissures starting and stopping, and varying rates of lava effusion, map details shown here are accurate as of the date/time noted. Shaded purple areas indicate lava flows erupted in 1840, 1955, 1960, and 2014-2015.
Kīlauea LERZ lava flows and fissures, June 3, 11:00 a.m.
Kīlauea LERZ lava flows and fissures, June 3, 11:00 a.m.Map as of 11:00 a.m. HST, June 3, 2018. Given the dynamic nature of Kīlauea's lower East Rift Zone eruption, with changing vent locations, fissures starting and stopping, and varying rates of lava effusion, map details shown here are accurate as of the date/time noted. Shaded purple areas indicate lava flows erupted in 1840, 1955, 1960, and 2014-2015.

West view of Fire Island, New York from the Fire Island Lighthouse
West view of Fire Island, New York from the Fire Island LighthouseThe Coastal Sediment Availability and Flux project conducts research and monitoring of sediment movement and coastal change at several barrier islands around the U.S.
West view of Fire Island, New York from the Fire Island Lighthouse
West view of Fire Island, New York from the Fire Island LighthouseThe Coastal Sediment Availability and Flux project conducts research and monitoring of sediment movement and coastal change at several barrier islands around the U.S.
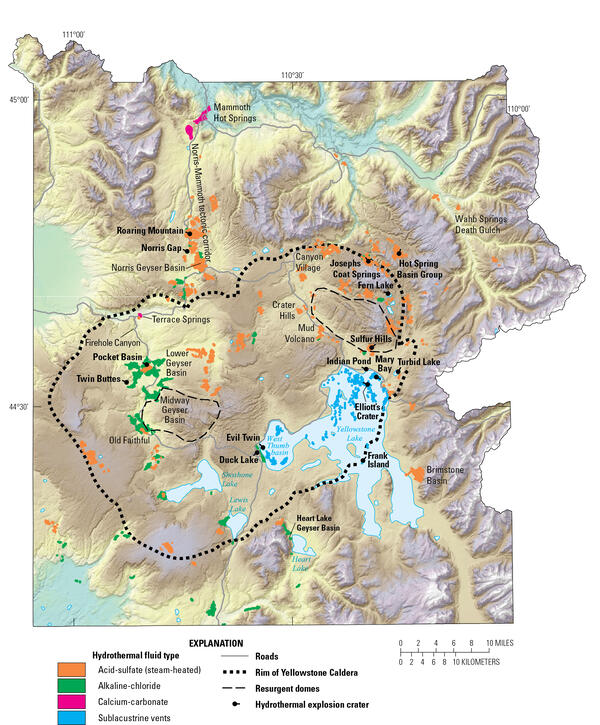
Map showing the location of active thermal areas
Large hydrothermal explosion craters shown with black dot and leader plus associated breccia deposits in Yellowstone National Park (locations from
Large hydrothermal explosion craters shown with black dot and leader plus associated breccia deposits in Yellowstone National Park (locations from
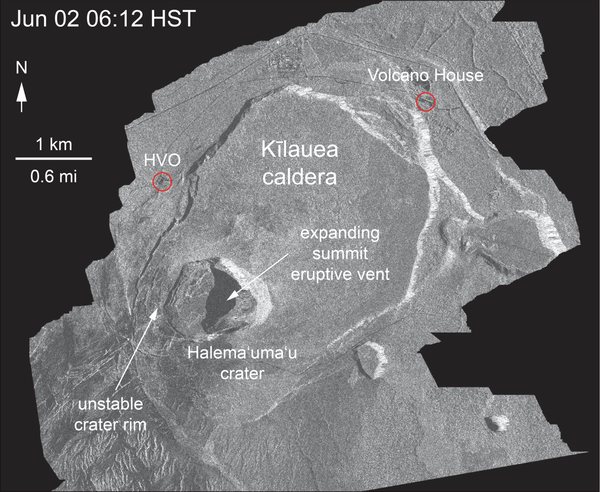
Kīlauea Volcano — Halema‘uma‘u Crater Slumping Animation
Kīlauea Volcano — Halema‘uma‘u Crater Slumping AnimationThis animated GIF shows a sequence of radar amplitude images that were acquired by the Italian Space Agency's Cosmo-SkyMed satellite system. The images illustrate changes to the caldera area of Kīlauea Volcano that occurred between May 5 and June 2 at 6:00 p.m. HST.
Kīlauea Volcano — Halema‘uma‘u Crater Slumping Animation
Kīlauea Volcano — Halema‘uma‘u Crater Slumping AnimationThis animated GIF shows a sequence of radar amplitude images that were acquired by the Italian Space Agency's Cosmo-SkyMed satellite system. The images illustrate changes to the caldera area of Kīlauea Volcano that occurred between May 5 and June 2 at 6:00 p.m. HST.

Kīlauea Volcano — Summit Plume

Kīlauea Volcano — Lava Near Four Corners
Northern edge of the fissure 8 flow front on the night of June 1, as it approached the intersection of Highways 132 and 137, known as "Four Corners."
Northern edge of the fissure 8 flow front on the night of June 1, as it approached the intersection of Highways 132 and 137, known as "Four Corners."

USGS vessels and staff collecting geophysical data in the nearshore
USGS vessels and staff collecting geophysical data in the nearshoreUSGS vessels and staff acquiring geophysical data in the nearshore. Collecting shoreface data in the water as close to the beach as possible is difficult with breaking waves. The USGS St. Petersburg Coastal and Marine Science Center adapted existing equipment for data collection in shallow water.
USGS vessels and staff collecting geophysical data in the nearshore
USGS vessels and staff collecting geophysical data in the nearshoreUSGS vessels and staff acquiring geophysical data in the nearshore. Collecting shoreface data in the water as close to the beach as possible is difficult with breaking waves. The USGS St. Petersburg Coastal and Marine Science Center adapted existing equipment for data collection in shallow water.

Kīlauea Volcano — Overflight of Fissure 8 Advancement
Kīlauea Volcano — Overflight of Fissure 8 AdvancementUSGS scientists on HVO's overflight this morning (June 2) captured this image of the fissure 8 flow front as it advanced west along Highway 132. Around the time of this photo, 7:15 a.m.
Kīlauea Volcano — Overflight of Fissure 8 Advancement
Kīlauea Volcano — Overflight of Fissure 8 AdvancementUSGS scientists on HVO's overflight this morning (June 2) captured this image of the fissure 8 flow front as it advanced west along Highway 132. Around the time of this photo, 7:15 a.m.

East side of the fissure 8 flow on the "lighthouse road" (east of t...
East side of the fissure 8 flow on the "lighthouse road" (east of t...East side of the fissure 8 flow on the "lighthouse road" (east of the Four Corners intersection). The ‘A‘ā flow was about 5 m (16 ft) thick when this photo was taken around 2:00 p.m. HST.
East side of the fissure 8 flow on the "lighthouse road" (east of t...
East side of the fissure 8 flow on the "lighthouse road" (east of t...East side of the fissure 8 flow on the "lighthouse road" (east of the Four Corners intersection). The ‘A‘ā flow was about 5 m (16 ft) thick when this photo was taken around 2:00 p.m. HST.

Kīlauea Volcano — Lava Flowing into Green Lake

Kīlauea Volcano — Documenting Flows
An HVO geologist documents the fissure 8 flow southeast of Four Corners (the intersection of Highways 132 and 137).
An HVO geologist documents the fissure 8 flow southeast of Four Corners (the intersection of Highways 132 and 137).

Kīlauea Volcano — `A`ā Flow
East side of the fissure 8 flow on the "lighthouse road" (east of the Four Corners intersection). The ‘a‘ā flow was about 5 m (16 ft) thick when this photo was taken around 2:00 p.m. HST.
East side of the fissure 8 flow on the "lighthouse road" (east of the Four Corners intersection). The ‘a‘ā flow was about 5 m (16 ft) thick when this photo was taken around 2:00 p.m. HST.

Kīlauea Volcano — Night Fountains (Fissure 8)
Overnight (June 1-2), fissure 8 lava fountains decreased to heights of about 50 m (164 feet). The moon can be seen in the upper left.
Overnight (June 1-2), fissure 8 lava fountains decreased to heights of about 50 m (164 feet). The moon can be seen in the upper left.

Fissure 8 flow front, June 3
USGS scientists on HVO's overflight this morning (June 2) captured this image of the fissure 8 flow front as it advanced west along Highway 132. Around the time of this photo, 7:15 a.m.
USGS scientists on HVO's overflight this morning (June 2) captured this image of the fissure 8 flow front as it advanced west along Highway 132. Around the time of this photo, 7:15 a.m.

Kīlauea LERZ lava flows and fissures, June 2, 1:30 p.m.
Kīlauea LERZ lava flows and fissures, June 2, 1:30 p.m.Map as of 1:30 p.m. HST, June 2, 2018. Given the dynamic nature of Kīlauea's lower East Rift Zone eruption, with changing vent locations, fissures starting and stopping, and varying rates of lava effusion, map details shown here are accurate as of the date/time noted. Shaded purple areas indicate lava flows erupted in 1840, 1955, 1960, and 2014-2015.
Kīlauea LERZ lava flows and fissures, June 2, 1:30 p.m.
Kīlauea LERZ lava flows and fissures, June 2, 1:30 p.m.Map as of 1:30 p.m. HST, June 2, 2018. Given the dynamic nature of Kīlauea's lower East Rift Zone eruption, with changing vent locations, fissures starting and stopping, and varying rates of lava effusion, map details shown here are accurate as of the date/time noted. Shaded purple areas indicate lava flows erupted in 1840, 1955, 1960, and 2014-2015.

An Geologist documents the fissure 8 flow SE of Four Corners (the i...
An Geologist documents the fissure 8 flow SE of Four Corners (the i...An HVO geologist documents the fissure 8 flow southeast of Four Corners (the intersection of Highways 132 and 137).
An Geologist documents the fissure 8 flow SE of Four Corners (the i...
An Geologist documents the fissure 8 flow SE of Four Corners (the i...An HVO geologist documents the fissure 8 flow southeast of Four Corners (the intersection of Highways 132 and 137).

Kīlauea Volcano — Fissure 8
Viewed from the intersection of Nohea and Leilani Streets at 10:15AM HST on June 1, the Fissure 8 lava fountain (to the right) appears to have decreased in height from previous sustained heights of 260 feet.
Viewed from the intersection of Nohea and Leilani Streets at 10:15AM HST on June 1, the Fissure 8 lava fountain (to the right) appears to have decreased in height from previous sustained heights of 260 feet.

Fissure 7 and 8 viewed from intersection of Nohea and Leilani Streets
Fissure 7 and 8 viewed from intersection of Nohea and Leilani StreetsViewed from the intersection of Nohea and Leilani Streets at 10:15AM HST on June 1, the Fissure 8 lava fountain (to the right) appears to have decreased in height from previous sustained heights of 260 feet. To the left, Fissure 7 appears to be showing renewed outgassing.
Fissure 7 and 8 viewed from intersection of Nohea and Leilani Streets
Fissure 7 and 8 viewed from intersection of Nohea and Leilani StreetsViewed from the intersection of Nohea and Leilani Streets at 10:15AM HST on June 1, the Fissure 8 lava fountain (to the right) appears to have decreased in height from previous sustained heights of 260 feet. To the left, Fissure 7 appears to be showing renewed outgassing.