
Photograph of Obsidian Cliff along Grand Loop Road between Norris and Mammoth Hot Springs. Photograph by John Good, U.S. National Park Service, 1965.
Images
Images related to Yellowstone Volcano Observatory.
Filter Total Items: 761

Obsidian Cliff lava flow, Yellowstone
Photograph of Obsidian Cliff along Grand Loop Road between Norris and Mammoth Hot Springs. Photograph by John Good, U.S. National Park Service, 1965.

Yellowstone map with rhyolite eruptions highlighted
Yellowstone map with rhyolite eruptions highlightedMap of Yellowstone National Park adapted from Christiansen and others (2007). The pink regions are rhyolite flows erupted within Yellowstone caldera; these flows contain 5% to 15% crystals by volume. The purple region is the Obsidian Cliff flow, which contains close to 0% crystals.

Crested pool, in Upper Geyser Basin near Castle Geyser
Crested pool, in Upper Geyser Basin near Castle GeyserCrested Pool, in Upper Geyser Basin near Castle Geyser. Geyser Hill is in the background, and Old Faithful is the steaming feature at the upper right. USGS photo by Mike Poland, October 12, 2020.

Angular unconformity atop Mount Everts, Yellowstone National Park
Angular unconformity atop Mount Everts, Yellowstone National ParkAn unconformity at the top of Mount Everts is located where the Huckleberry Ridge Tuff, 2.1 million years old, lies directly on top of Cretaceous sediments that are ~60 million years old and greater. Right at the unconformity are conspicuous orange and black colors. The orange is oxidation of the sedimentary unit where it is in contact with the ash, whic

Highway 89 winding through Silver Gate in Yellowstone National Park
Highway 89 winding through Silver Gate in Yellowstone National ParkA few miles south of Mammoth Hot Springs in Yellowstone National Park, Highway 89 winds through the white/gray jumble of rocks known as the Hoodoos, or Silver Gate, that formed when travertine from Terrace Mountain collapsed in a landslide.

Silver Gate landslide complex in Yellowstone National Park
Silver Gate landslide complex in Yellowstone National ParkSilver Gate landslide complex in Yellowstone National Park. The jumbled nature of the calcium-carbonate rocks is evidence that the deposit was formed by collapse of a travertine hot-spring terrace that might once have looked like Mammoth Hot Springs does today.

Panoramic view of Pocket Basin, Yellowstone National Park
Panoramic view of Pocket Basin, Yellowstone National ParkPanoramic photo of Pocket Basin, a hydrothermal explosion crater in Yellowstone National Park's Lower Geyser Basin, taken from the northeast rim looking southwest into the crater. Pocket Basin is a U-shaped crater that is dissected on the SW edge by the Firehole River, visible on the far-right of the photo.

The inside of a Yellowstone borehole seismometer equipment enclosure
The inside of a Yellowstone borehole seismometer equipment enclosureThe inside of a borehole seismometer equipment enclosure is full of batteries, cables, data communications equipment and data recording instruments. Some of the geodetic infrastructure in Yellowstone National Park is colocated with seismic equipment. In this case, the communications downlink radio for the GNSS station is housed with the borehole enc

GNSS site LKWY, on the north side of Yellowstone Lake
GNSS site LKWY, on the north side of Yellowstone LakeGNSS site LKWY, which was visited in September 2020 to install new GNSS equipment and upgrade the communications for improved data quality. The site is now capable of collecting several times more observation data then was possible with the original older equipment.

View of Absaroka Range from Eagle Peak, WY, toward the southwest
View of Absaroka Range from Eagle Peak, WY, toward the southwestView of Absaroka Range from Eagle Peak, WY, toward the southwest.
View of Absaroka Range from Eagle Peak, WY, toward the southwest
View of Absaroka Range from Eagle Peak, WY, toward the southwestView of Absaroka Range from Eagle Peak, WY, toward the southwest.

Upper Geyser Basin viewed from the Old Faithful webcam
Upper Geyser Basin viewed from the Old Faithful webcamThe Upper Geyser Basin viewed from the Old Faithful webcam. Hot water was piped from Solitary Geyser to the former site of the geyser bathhouse.
Upper Geyser Basin viewed from the Old Faithful webcam
Upper Geyser Basin viewed from the Old Faithful webcamThe Upper Geyser Basin viewed from the Old Faithful webcam. Hot water was piped from Solitary Geyser to the former site of the geyser bathhouse.

Map showing subtle terraces on the north side of Yellowstone Lake
Map showing subtle terraces on the north side of Yellowstone LakeShaded relief map based on high-resolution topographic data from lidar and showing subtle terraces on the north side of Yellowstone Lake (a few example terraces are marked by yellow arrows and traced by dashed and dotted white lines).

Map of thermal areas and lakes in Yellowstone National Park
Map of thermal areas and lakes in Yellowstone National ParkMap of thermal areas in Yellowstone (red), as well as lakes (outlined in blue), many of which have thermal areas on their shores or beneath their surfaces.
Map of thermal areas and lakes in Yellowstone National Park
Map of thermal areas and lakes in Yellowstone National ParkMap of thermal areas in Yellowstone (red), as well as lakes (outlined in blue), many of which have thermal areas on their shores or beneath their surfaces.

Fern Lake, Yellowstone National Park, in different seasons
Fern Lake, Yellowstone National Park, in different seasonsHigh-resolution images of Fern Lake from different seasons. North is up. Fern Lake is about 1 km across from east to west. Red arrows in the winter image point to large zones of open water, indicating either nearshore springs or underwater hydrothermal vents, but there are also many smaller zones of open water that are conspicuous.

Map of geodetic infrastructure located in Yellowstone National Park
Map of geodetic infrastructure located in Yellowstone National ParkThe UNAVCO-operated geodetic infrastructure located in Yellowstone National Park consists of over a dozen continuously operating geodetic sites. Most of these sites stream real-time data to the UNAVCO data center. After the September 2020 maintenance trip, there are now 8 fully upgraded GNSS sites (red square) located in the park.
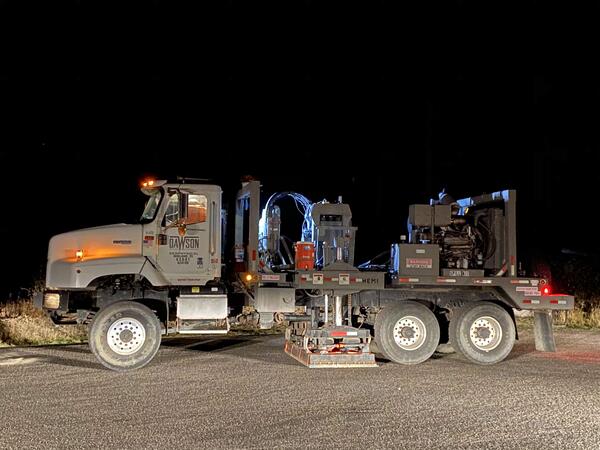
Vibroseis truck in Yellowstone National Park
A 53,000-pound vibroseis truck, with a hydraulic vibration plate that creates signals like tiny earthquakes. The truck is parked at a roadside pullout near the Continental Divide in Yellowstone National Park. Photo by Jamie Farrell, University of Utah, September 2020, taken under Yellowstone National Park research permit YELL-2020-SCI-8146.
A 53,000-pound vibroseis truck, with a hydraulic vibration plate that creates signals like tiny earthquakes. The truck is parked at a roadside pullout near the Continental Divide in Yellowstone National Park. Photo by Jamie Farrell, University of Utah, September 2020, taken under Yellowstone National Park research permit YELL-2020-SCI-8146.

Thin section of lava sample from Yellowstone
Thin section made by slicing a small layer off the surface of a hand sample of Yeloowstone lava. Note the marker for scale.
Thin section made by slicing a small layer off the surface of a hand sample of Yeloowstone lava. Note the marker for scale.

View of dead lodgepole pine trees with “bobby socks” in Lower Geyser Basin, Yellowstone National Park
View of dead lodgepole pine trees with “bobby socks” in Lower Geyser Basin, Yellowstone National ParkView of dead lodgepole pine trees with “bobby socks” from having taken up hydrothermal water that contains dissolved silica and other minerals. Photo taken south of the Fountain Paint Pot Trail in Lower Geyser Basin, Yellowstone National Park, looking toward the southeast. USGS photo by Stanley Mordensky, August 28, 2020.

Example of a boundary problem in the Yellowstone geologic map
Example of a boundary problem in the Yellowstone geologic mapAn example of a boundary iproblem n the Yellowstone National Park geologic map, which was stitched together from many smaller mapped sections. The red line highlights the contacts that contain different units across the boundary.

Giantess Geyser in eruption on August 26, 2020
Giantess Geyser in eruption at approximately 10:00 AM MDT on August 26, 2020. Old Faithful is erupting in the center background.
Giantess Geyser in eruption at approximately 10:00 AM MDT on August 26, 2020. Old Faithful is erupting in the center background.

Tree rings in a Rocky Mountain Juniper, Yellowstone National Park
Tree rings in a Rocky Mountain Juniper, Yellowstone National ParkA scanned image of Rocky Mountain juniper deadwood sample GGR100 collected in the northern part of Yellowstone National Park under permit YELL-5582. The full length of this sample covers the time period 723-1792 CE.