Panorama of Hayden Valley, Yellowstone National Park
Panorama of Hayden Valley, Yellowstone National ParkPanoramic photo of Hayden Valley looking east toward the Yellowstone River from the Mary Mountain trail.


Official websites use .gov
A .gov website belongs to an official government organization in the United States.

Secure .gov websites use HTTPS
A lock () or https:// means you’ve safely connected to the .gov website. Share sensitive information only on official, secure websites.

Images related to Yellowstone Volcano Observatory.

Panoramic photo of Hayden Valley looking east toward the Yellowstone River from the Mary Mountain trail.
Panoramic photo of Hayden Valley looking east toward the Yellowstone River from the Mary Mountain trail.

A small stream, Violet Creek, winds its way through Hayden Valley in Yellowstone National Park.
A small stream, Violet Creek, winds its way through Hayden Valley in Yellowstone National Park.

Photo of geologic units of the Absaroka volcanic province in northeastern Yellowstone National Park that shows volcaniclastic sandstones grading up into a conglomerate, followed by another sequence of sandstone to conglomerate. These repeating layers of the same-looking material make it difficult to assign them to a specific volcanic group.
Photo of geologic units of the Absaroka volcanic province in northeastern Yellowstone National Park that shows volcaniclastic sandstones grading up into a conglomerate, followed by another sequence of sandstone to conglomerate. These repeating layers of the same-looking material make it difficult to assign them to a specific volcanic group.

A view into the Absaroka Mountains in northeastern Yellowstone National Park. While the Absarokas of today look a little different due to glacial activity, these are the same mountains that existed over the last 53 million years, well before the arrival of the Yellowstone hot spot.
A view into the Absaroka Mountains in northeastern Yellowstone National Park. While the Absarokas of today look a little different due to glacial activity, these are the same mountains that existed over the last 53 million years, well before the arrival of the Yellowstone hot spot.

Geologists from Montana State University study an outcrop of diorite (a silicic igneous rock that cooled slowly beneath the ground). An outcrop of this size is important because it is easier to see any structural relations along with rock composition.
Geologists from Montana State University study an outcrop of diorite (a silicic igneous rock that cooled slowly beneath the ground). An outcrop of this size is important because it is easier to see any structural relations along with rock composition.

Newly identified ash flow sheets within the Yellowstone–Snake River Plain volcanic province (Y-SRP). The small inset in the center shows the track of the Yellowstone hotspot and its associated eruptive centers in light gray (M—McDermitt; OH—Owyhee-Humboldt; BJ—Bruneau-Jarbidge; TF—Twin Falls; P—Picabo; H—Heise; Y—Yellowstone).
Newly identified ash flow sheets within the Yellowstone–Snake River Plain volcanic province (Y-SRP). The small inset in the center shows the track of the Yellowstone hotspot and its associated eruptive centers in light gray (M—McDermitt; OH—Owyhee-Humboldt; BJ—Bruneau-Jarbidge; TF—Twin Falls; P—Picabo; H—Heise; Y—Yellowstone).

Petrified trees on Specimen Ridge, Yellowstone National Park. NPS photo by Jake Frank, June 13, 2020.
Petrified trees on Specimen Ridge, Yellowstone National Park. NPS photo by Jake Frank, June 13, 2020.
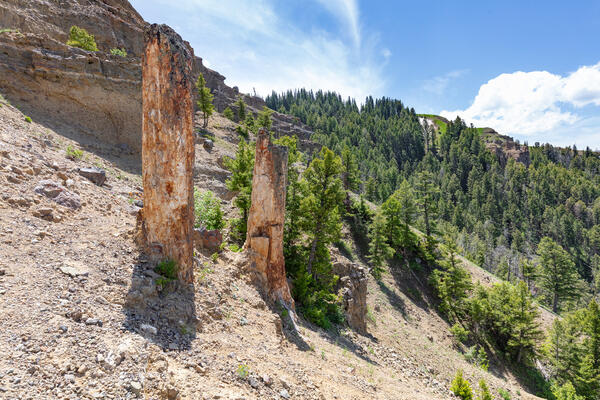
Two standing petrified (silicified) trees on Specimen Ridge in northeastern Yellowstone National Park. Photo by Jacob W. Frank, Yellowstone National Park (https://www.flickr.com/photos/yellowstonenps/50016729252).
Two standing petrified (silicified) trees on Specimen Ridge in northeastern Yellowstone National Park. Photo by Jacob W. Frank, Yellowstone National Park (https://www.flickr.com/photos/yellowstonenps/50016729252).

Simplified Geologic Map of Yellowstone, modified from USGS I-711 by Marli Miller, University of Oregon. All rock material resulting from the major caldera-forming eruptions are labelled at Qt, where the dashed caldera boundary highlights the scale of these events. Older volcanic, sedimentary and metamorphic rocks are found outside of this boundary.
Simplified Geologic Map of Yellowstone, modified from USGS I-711 by Marli Miller, University of Oregon. All rock material resulting from the major caldera-forming eruptions are labelled at Qt, where the dashed caldera boundary highlights the scale of these events. Older volcanic, sedimentary and metamorphic rocks are found outside of this boundary.

A Light Detection and Ranging (LiDAR) shaded relief image overlaid on an aerial imagery basemap. The Sulphur Hills, part of the Sour Creek Resurgent Dome, are visible in the upper half of the image, while the floodplain and meanders of Pelican Creek are visible at the bottom.
A Light Detection and Ranging (LiDAR) shaded relief image overlaid on an aerial imagery basemap. The Sulphur Hills, part of the Sour Creek Resurgent Dome, are visible in the upper half of the image, while the floodplain and meanders of Pelican Creek are visible at the bottom.

Geology of Yellowstone Map zoomed into the Lower Geyser Basin. This view shows a park-wide geologic map overlaid on a shaded relief layer from a digital elevation model. Red diamonds and black circles show geysers and gas sample locations, respectively.
Geology of Yellowstone Map zoomed into the Lower Geyser Basin. This view shows a park-wide geologic map overlaid on a shaded relief layer from a digital elevation model. Red diamonds and black circles show geysers and gas sample locations, respectively.

Schematic diagram illustrating the difference between a main shock with aftershocks (top), a sequences of foreshocks, main shock, and aftershocks (middle), and a seismic swarm (bottom). Adapted from manuscript by Farrell and others, 2009.
Schematic diagram illustrating the difference between a main shock with aftershocks (top), a sequences of foreshocks, main shock, and aftershocks (middle), and a seismic swarm (bottom). Adapted from manuscript by Farrell and others, 2009.

Map of earthquakes greater than M1.5 that occurred between March 1 and May 12, 2020, in the Intermountain West. The main shock-aftershock sequences in central Idaho and near Salt Lake City are labeled. Orange dots are earthquakes that occurred within 24 hours, and yellow 1 week, of the map being generated (May 12, 2020)
Map of earthquakes greater than M1.5 that occurred between March 1 and May 12, 2020, in the Intermountain West. The main shock-aftershock sequences in central Idaho and near Salt Lake City are labeled. Orange dots are earthquakes that occurred within 24 hours, and yellow 1 week, of the map being generated (May 12, 2020)

Archive view of the Yellowstone Volcano Observatory website in 2001.
Archive view of the Yellowstone Volcano Observatory website in 2001.

Archive view of the Yellowstone Volcano Observatory website in 2009.
Archive view of the Yellowstone Volcano Observatory website in 2009.

Mobile view of the Yellowstone Volcano Observatory website.
Mobile view of the Yellowstone Volcano Observatory website.
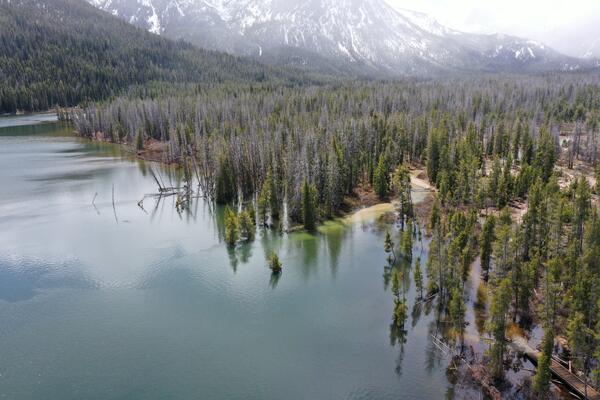
Submerged trees at the inlet delta of Stanley Lake, Idaho. Liquefaction during shaking from the March 31, 2020, Stanley earthquake caused ground subsidence and collapse of the delta. Photo by Zach Lifton, Idaho Geological Survey, May 2020.
Submerged trees at the inlet delta of Stanley Lake, Idaho. Liquefaction during shaking from the March 31, 2020, Stanley earthquake caused ground subsidence and collapse of the delta. Photo by Zach Lifton, Idaho Geological Survey, May 2020.
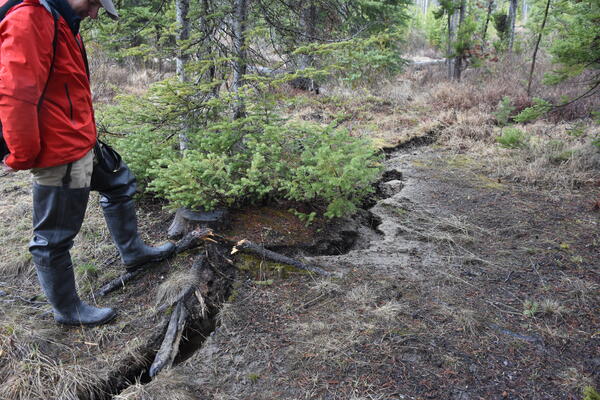
Ground fissure along the shore of Stanley Lake, Idaho, cause by liquefaction during shaking from the March 31, 2020, Stanley earthquake. Photo by Zach Lifton, Idaho Geological Survey, May 2020.
Ground fissure along the shore of Stanley Lake, Idaho, cause by liquefaction during shaking from the March 31, 2020, Stanley earthquake. Photo by Zach Lifton, Idaho Geological Survey, May 2020.

Sunset lake in Black Sand Basin of Yellowstone National Park
Sunset lake in Black Sand Basin of Yellowstone National Park

Grand Prismatic Spring in Midway Geyser Basin Yellowstone National Park on October 19, 2017.
Grand Prismatic Spring in Midway Geyser Basin Yellowstone National Park on October 19, 2017.

The relationship between Δ30 and N2/3He ratios in hydrothermal gases from Iceland and Yellowstone. Δ30 and N2/3He ratios are shown for samples collected from gases in Iceland (yellow circles) and Yellowstone (red circles). The Yellowstone mantle-endmember is arguably indistinguishable in terms of N2/3He from the convecting upper mantle (grey diamonds).
The relationship between Δ30 and N2/3He ratios in hydrothermal gases from Iceland and Yellowstone. Δ30 and N2/3He ratios are shown for samples collected from gases in Iceland (yellow circles) and Yellowstone (red circles). The Yellowstone mantle-endmember is arguably indistinguishable in terms of N2/3He from the convecting upper mantle (grey diamonds).