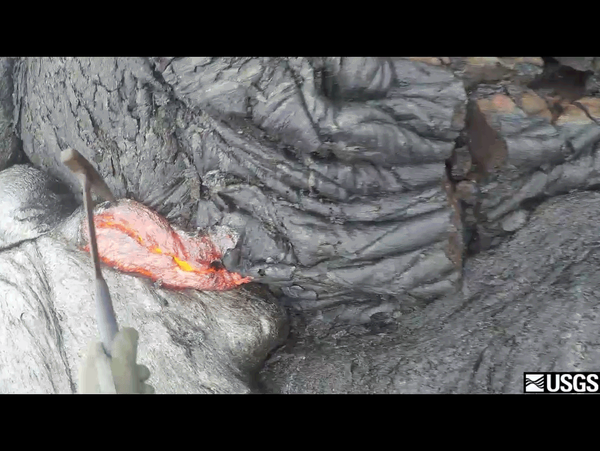
U.S. flag

An official website of the United States government

Images

Volcano Hazard Program images.

Filter Total Items: 6273
Geologic mapping looks to the past to reveal the future...
Geologic mapping looks to past to reveal the future

An HVO field geologist must make his way through dense forest to map the full extent of an old Mauna Loa lava flow. USGS photo.

Several small collapses as summit lava lake slowly drops...
Several small collapses as summit lava lake slowly drops

Summit deflation over the past day was associated with the summit lava lake level slowly dropping. When this happens, collapses commonly occur within the Overlook crater. Solidified lava, attached to the Overlook crater walls, collapsed into the lake on several occasions today, triggering small dust plumes and agitation of the lake surface.

Summit deflation over the past day was associated with the summit lava lake level slowly dropping. When this happens, collapses commonly occur within the Overlook crater. Solidified lava, attached to the Overlook crater walls, collapsed into the lake on several occasions today, triggering small dust plumes and agitation of the lake surface.

Landsat satellite image shows June 27th lava flow...
Landsat satellite image shows June 27th lava flow

This satellite image was captured on Tuesday, October 13, 2015 by the Landsat 8 satellite. Although this is a false-color image, the color map has been chosen to mimic what the human eye would expect to see. Bright red pixels depict areas of very high temperatures and show active lava. White areas are clouds.

This satellite image was captured on Tuesday, October 13, 2015 by the Landsat 8 satellite. Although this is a false-color image, the color map has been chosen to mimic what the human eye would expect to see. Bright red pixels depict areas of very high temperatures and show active lava. White areas are clouds.

Lessons learned from the 2006 Kīholo Bay earthquakes...
Lessons learned from the 2006 Kīholo Bay earthquakes

A Hawaiian Volcano Observatory volunteer demonstrates "Drop! Cover! Hold on!"—actions that can reduce injuries or prevent death during an earthquake.

A Hawaiian Volcano Observatory volunteer demonstrates "Drop! Cover! Hold on!"—actions that can reduce injuries or prevent death during an earthquake.

Lessons learned from the 2006 Kīholo Bay earthquakes...
Lessons learned from the 2006 Kīholo Bay earthquakes

Graphic from the Great Hawaii ShakeOut website (http://shakeout.org/hawaii/) showing the recommended actions to protect yourself during an earthquake.

Small-scale map of flow field...
Small-scale map of flow field

This small-scale map shows Kīlauea's active East Rift Zone lava flow in relation to the eastern part of the Island of Hawai‘i. The area of the flow on September 11 is shown in pink, while widening and advancement of the flow as of September 30 is shown in red. The yellow lines show the active lava tube system.

This small-scale map shows Kīlauea's active East Rift Zone lava flow in relation to the eastern part of the Island of Hawai‘i. The area of the flow on September 11 is shown in pink, while widening and advancement of the flow as of September 30 is shown in red. The yellow lines show the active lava tube system.

Map showing flow field changes...
Map showing flow field changes

This map shows recent changes to Kīlauea's active East Rift Zone lava flow field. The area of the flow on September 11 is shown in pink, while widening and advancement of the flow as of September 30 (based on satellite imagery) is shown in red. The yellow lines show the active lava tube system.

This map shows recent changes to Kīlauea's active East Rift Zone lava flow field. The area of the flow on September 11 is shown in pink, while widening and advancement of the flow as of September 30 (based on satellite imagery) is shown in red. The yellow lines show the active lava tube system.

A repeating loop showing a hammer scooping lava from a flow and dropping it into a bucket.
Lava Sampling
Lava Sampling
Lava Sampling

This is an animated GIF, taken from a longer video, showing the moment that this geologist from the Hawaiian Volcano Observatory (HVO) scoops up lava from an active flow and drops it into a bucket of water to cool it down. 

This is an animated GIF, taken from a longer video, showing the moment that this geologist from the Hawaiian Volcano Observatory (HVO) scoops up lava from an active flow and drops it into a bucket of water to cool it down. 

HVO geologists hike through thick fume and fog to reach the lava po...
Geologists hike through thick fume and fog to reach the lava pond i...

HVO geologists hike through thick fume and fog to reach the lava pond in the western portion of Pu‘u ‘Ō‘ō crater.

Scattered breakouts remain active northeast of Pu‘u ‘Ō‘ō...
Scattered breakouts remain active NE of Pu‘u ‘Ō‘ō

The June 27th lava flow remains active with scattered breakouts northeast of Pu‘u ‘Ō‘ō. The farthest active breakout today was about 6.5 km (4 miles) from Pu‘u ‘Ō‘ō. This photograph shows activity along the northern flow boundary, where breakouts continue to burn vegetation.

The June 27th lava flow remains active with scattered breakouts northeast of Pu‘u ‘Ō‘ō. The farthest active breakout today was about 6.5 km (4 miles) from Pu‘u ‘Ō‘ō. This photograph shows activity along the northern flow boundary, where breakouts continue to burn vegetation.

This Quicktime video shows lava sample collection from the perspect...
Lava sample collection from the perspective of an Geologist
No major changes in the lava lake at Halema‘uma‘u Crater...
No major changes in the lava lake at Halema‘uma‘u

This wide view shows the lava lake active within the Overlook crater, which is set within the larger Halema‘uma‘u Crater. There have been no major changes in the lake in recent weeks. This morning the lava lake was roughly 60 meters (200 feet) below the rim of the Overlook crater.

This wide view shows the lava lake active within the Overlook crater, which is set within the larger Halema‘uma‘u Crater. There have been no major changes in the lake in recent weeks. This morning the lava lake was roughly 60 meters (200 feet) below the rim of the Overlook crater.

This view looks west towards Pu‘u ‘Ō‘ō, which can be seen in the up...

This view looks west towards Pu‘u ‘Ō‘ō, which can be seen in the upper left. The most distant active breakouts today were located near the center of the photograph, at a spot roughly 6.5 km (4 miles) from Pu‘u ‘Ō‘ō.

This view looks west towards Pu‘u ‘Ō‘ō, which can be seen in the upper left. The most distant active breakouts today were located near the center of the photograph, at a spot roughly 6.5 km (4 miles) from Pu‘u ‘Ō‘ō.

A closer look at the lava lake in the Overlook crater....
lava lake in the Overlook crater.
Bottled soda helps us to understand volcanic eruptions...
Bottled soda helps us to understand volcanic eruptions

Replica of a 19th century soda bottle that was sealed with a blue marble (visible in lower crimp of the bottle). Bottles like this played a part in creating the bottled soda analogy of how and why volcanoes erupt. The Halema‘uma‘u Overlook gas plume is visible in the background. USGS photo.

Replica of a 19th century soda bottle that was sealed with a blue marble (visible in lower crimp of the bottle). Bottles like this played a part in creating the bottled soda analogy of how and why volcanoes erupt. The Halema‘uma‘u Overlook gas plume is visible in the background. USGS photo.

Routine check of summit cameras...
Routine check of summit cameras

This panorama is from the north rim of Mauna Loa's summit caldera, Moku‘āweoweo, and shows the thermal camera watching for changes on the caldera floor.

This panorama is from the north rim of Mauna Loa's summit caldera, Moku‘āweoweo, and shows the thermal camera watching for changes on the caldera floor.

An HVO geologist performs a routine check of the thermal camera and...
An Geologist performs a routine check of the thermal camera and web...

An HVO geologist performs a routine check of the thermal camera and webcam at the summit of Mauna Loa.

USGS Volcano Alert Level for Mauna Loa Elevated from Normal to Advi...
Volcano Alert Level for Mauna Loa Elevated from Normal to Advisory

USGS Hawaiian Volcano Observatory scientists are closely monitoring recent signs of unrest on Mauna Loa, the largest active volcano on Earth. In this 1985 aerial photo, Mauna Loa looms above Kīlauea Volcano's summit caldera (left center) and nearly obscures Hualālai in the far distance (upper right). USGS photo.

USGS Hawaiian Volcano Observatory scientists are closely monitoring recent signs of unrest on Mauna Loa, the largest active volcano on Earth. In this 1985 aerial photo, Mauna Loa looms above Kīlauea Volcano's summit caldera (left center) and nearly obscures Hualālai in the far distance (upper right). USGS photo.

Mauna Loa - Earthquake and Deformation Data 2010-2015...
Mauna Loa - Earthquake and Deformation Data 2010-2016

TOP: Mauna Loa weekly earthquake rates between 2010 and September 17, 2015. Blue bars indicate the number of earthquakes that were located by the USGS Hawaiian Volcano Observatory seismic network. Earthquakes of all magnitudes are plotted. Subtle increases in earthquake rates started in mid-2013, while more obvious changes in rates started in 2014.

TOP: Mauna Loa weekly earthquake rates between 2010 and September 17, 2015. Blue bars indicate the number of earthquakes that were located by the USGS Hawaiian Volcano Observatory seismic network. Earthquakes of all magnitudes are plotted. Subtle increases in earthquake rates started in mid-2013, while more obvious changes in rates started in 2014.

Was this page helpful?