U.S. flag

An official website of the United States government

Images

Volcano Hazard Program images.

Filter Total Items: 6279
image related to volcanoes. See description
A pack string crossing the Yellowstone River in the remote Thorofare region

A pack string crossing the Yellowstone River in the remote Thorofare region. National Park Service photo courtesy of Sherrie and Ron White, August 21, 2016.

Imperial Geyser with colorful water. Yellowstone
Imperial Geyser looking south, Yellowstone

Imperial Geyser hot spring pool in Yellowstone National Park is about 30 m (about 100 ft) across and contains alkaline-Cl waters with a steam vent in the pool and mudpots outside the pool area (in the upper right part of this photo). USGS Photo by Pat Shanks, 2019.

Imperial Geyser hot spring pool in Yellowstone National Park is about 30 m (about 100 ft) across and contains alkaline-Cl waters with a steam vent in the pool and mudpots outside the pool area (in the upper right part of this photo). USGS Photo by Pat Shanks, 2019.

image related to volcanoes. See description
Visitors in the busy Old Faithful area

Visitors in the busy Old Faithful area. National Park Service photo by Neal Herbert, May 27, 2017.

Visitors in the busy Old Faithful area. National Park Service photo by Neal Herbert, May 27, 2017.

image related to volcanoes. See description
Map of roads in the Greater Yellowstone Ecosystem

Map of roads in the Greater Yellowstone Ecosystem. Source: Yellowstone Spatial Analysis Center.

image related to volcanoes. See description
Halema‘uma‘u crater lake on January 31

Field observations today show that the diameters of the crater lake within Halema‘uma‘u at the summit of Kīlauea are about 94 m (308 ft) north-south and around 192-195 m (630-640 ft) east-west. Too much steam at the west end interfered with measurements this morning.

Field observations today show that the diameters of the crater lake within Halema‘uma‘u at the summit of Kīlauea are about 94 m (308 ft) north-south and around 192-195 m (630-640 ft) east-west. Too much steam at the west end interfered with measurements this morning.

image related to volcanoes. See description
Water samples collected from Halema‘uma‘u crater lake on January 17

On January 17, 2020, USGS-HVO scientists and DOI Unoccupied Aerial System (UAS) team members collected three additional samples of water from the Halema‘uma‘u crater lake. Here, the sampling device and temperature logger were readied for takeoff. The plastic sleeve was attached to the UAS (drone) with a cord about 20 feet (6 m) long.

On January 17, 2020, USGS-HVO scientists and DOI Unoccupied Aerial System (UAS) team members collected three additional samples of water from the Halema‘uma‘u crater lake. Here, the sampling device and temperature logger were readied for takeoff. The plastic sleeve was attached to the UAS (drone) with a cord about 20 feet (6 m) long.

image related to volcanoes. See description
A typical section of shoreline in the Kapoho area, formed by thick toothpaste la

A typical section of shoreline in the Kapoho area, formed by thick toothpaste lava that originated from Fissure 8 during the 2018 eruption. USGS photo by M. Zoeller.

Sabrina Brown collecting samples from Yellowstone Lake core YL16-2C

Sabrina Brown collecting samples from Yellowstone Lake core YL16-2C at the National Lacustrine Core Facility (LacCore) at the University of Minnesota.

Map showing ice cover in the Yellowstone region

Map showing ice cover in the Yellowstone region. Light shaded areas bounded by black and red lines indicate areas covered during the Pinedale (about 20,000-15,000 years ago) and Bull Lake (about 150,000 years ago) glaciations, respectively. Blue lines are contours in thousands of feet on the maximum reconstructed Pinedale glacier surface.

Map showing ice cover in the Yellowstone region. Light shaded areas bounded by black and red lines indicate areas covered during the Pinedale (about 20,000-15,000 years ago) and Bull Lake (about 150,000 years ago) glaciations, respectively. Blue lines are contours in thousands of feet on the maximum reconstructed Pinedale glacier surface.

Image of Yellowstone Lake showing location of core YL16-2C

A digital elevation map of Yellowstone National Park (left) with the location of Yellowstone Lake indicated by the white box. Satellite image (right) of the study site with collection location of core YL16-2C shown by the red circle. Map was originally published in Sabrina Brown’s dissertation (2019).

A digital elevation map of Yellowstone National Park (left) with the location of Yellowstone Lake indicated by the white box. Satellite image (right) of the study site with collection location of core YL16-2C shown by the red circle. Map was originally published in Sabrina Brown’s dissertation (2019).

Summary diagram of the geological record and timing of the Huckleberry Ridge Tuff eruption
Summary geologic record of the Huckleberry Ridge Tuff eruption
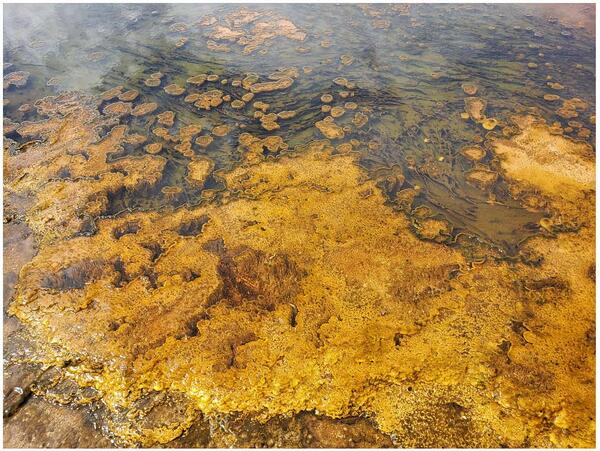
Alkaline hot spring outflow channel in the Biscuit Basin with a wide array of phototrophic microbial community textures
Alkaline hot spring outflow channel in the Biscuit Basin

A wide array of phototrophic microbial community textures exhibited in an alkaline (pH ~8.5) hot spring outflow channel in the Biscuit Basin, including thick mats, toadstools, ropes, and pinnacles. The differences in color are due to pigments (chlorophylls, bacteriochlorophylls, and carotenoids) produced by phototrophic microorganisms.

A wide array of phototrophic microbial community textures exhibited in an alkaline (pH ~8.5) hot spring outflow channel in the Biscuit Basin, including thick mats, toadstools, ropes, and pinnacles. The differences in color are due to pigments (chlorophylls, bacteriochlorophylls, and carotenoids) produced by phototrophic microorganisms.

Man with glasses and gray hair standing in front of green plants
Manuel Nathenson
Manuel Nathenson
Manuel Nathenson

Manuel Nathenson is a scientists emeritus with the USGS Volcano Science Center.

Manuel Nathenson is a scientists emeritus with the USGS Volcano Science Center.

Map of seismicity (yellow circles) in Yellowstone during 2019
Map of seismicity in the Yellowstone region during 2019.

Map of seismicity (yellow circles) in the Yellowstone region during 2019. Gray lines are roads, red line shows the caldera boundary, Yellowstone National Park is outlined by black dashed line, and gray dashed lines denote state boundaries.

Map of seismicity (yellow circles) in the Yellowstone region during 2019. Gray lines are roads, red line shows the caldera boundary, Yellowstone National Park is outlined by black dashed line, and gray dashed lines denote state boundaries.

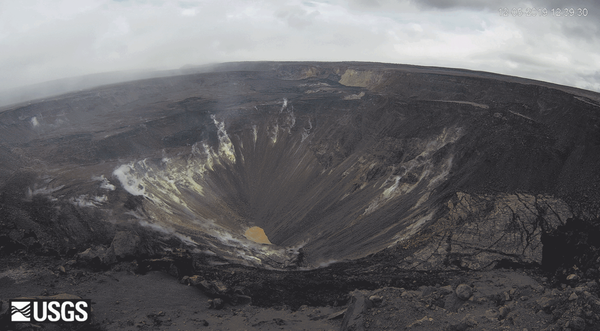
Animated GIF showing rise of crater lake
Kīlauea summit water lake KW webcam images 11-1-2019 to 10-30-2020

ANIMATED GIF: The KWcam webcam has been imaging the Kīlauea summit water lake for just over a year now, tracking visual changes in the lake including water level and color.

Small acidic hot spring in the Gibbon Geyser Basin of Yellowstone National Park

An unnamed small acidic (pH ~3) hot spring (with a temperature of about 55°C at the source) in the Gibbon Geyser Basin of Yellowstone National Park. The yellow region is due to the precipitation of sulfur by sulfide-oxidizing chemotrophic microorganisms.

An unnamed small acidic (pH ~3) hot spring (with a temperature of about 55°C at the source) in the Gibbon Geyser Basin of Yellowstone National Park. The yellow region is due to the precipitation of sulfur by sulfide-oxidizing chemotrophic microorganisms.

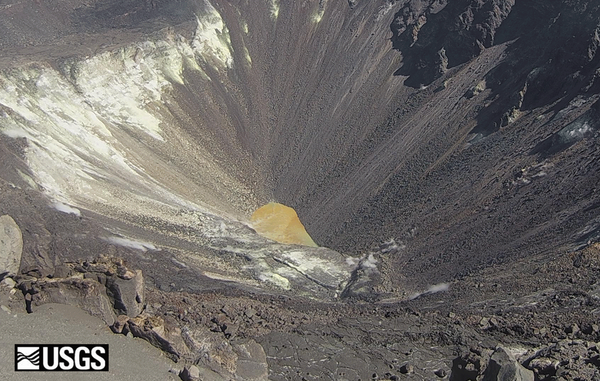
Animated GIF showing rise of crater lake
Kīlauea summit water lake KW webcam images 11-1-2019 to 10-30-2020

ANNIMATED GIF: This animated image file (GIF) of the Kīlauea summit water lake is a cropped version this file, showing a close-up view of the lake.

Was this page helpful?