
A loggerhead sea turtle, outfitted with a popoff ADL package (orange item on the turtle’s back), is released by New England Aquarium Biologist Nick Whitney.
Images
Coastal and Marine Hazards and Resources Program images.
Filter Total Items: 2413
Releasing a loggerhead with radio tag
A loggerhead sea turtle, outfitted with a popoff ADL package (orange item on the turtle’s back), is released by New England Aquarium Biologist Nick Whitney.
Deployment of the chirp seismic instrument from the beach
Deployment of the chirp seismic instrument from the beachMost underwater seismic data is collected from large research vessels; however, the shoreface environment is shallower than areas in which most seismic surveys occur. To get the information we need to assess changes in shoreface geology, we mount our seismic instruments on pontoon floats and deploy the instrument from the beach.

Seismic instrument on pontoon floats deployed from the beach
Seismic instrument on pontoon floats deployed from the beachWe mount our seismic instrument on pontoon floats with wheels. This setup is deployed from the beach and eventually towed behind our survey vessel.
Seismic instrument on pontoon floats deployed from the beach
Seismic instrument on pontoon floats deployed from the beachWe mount our seismic instrument on pontoon floats with wheels. This setup is deployed from the beach and eventually towed behind our survey vessel.

Topography and Bathymetry of Southern Cascadia
Topography and bathymetry of southern Cascadia, which includes southern Oregon and northern California (seafloor depths between 200 and 3000 m are shown in the spectrum color scale from red (shallower) to purple (deeper). The land and continental shelf are shown in grayscale slope shading where darker colors represent steeper slopes.
Topography and bathymetry of southern Cascadia, which includes southern Oregon and northern California (seafloor depths between 200 and 3000 m are shown in the spectrum color scale from red (shallower) to purple (deeper). The land and continental shelf are shown in grayscale slope shading where darker colors represent steeper slopes.

Fieldwork in California’s Sacramento-San Joaquin River Delta
Fieldwork in California’s Sacramento-San Joaquin River DeltaTop row, left to right: Cordell Johnson (left) and Evan Dailey use the USGS R/V Fast Eddy to collect water samples. Cordell Johnson (left) and Jessie Lacy prepare to deploy a tripod holding instruments to measure water level, currents, and suspended sediment.

Three-dimensional model of Chimney Bluffs, New York along Lake Ontari
Three-dimensional model of Chimney Bluffs, New York along Lake OntariThree-dimensional model of Chimney Bluffs, New York along Lake Ontario created from low-altitude digital images collected from an unmanned aerial system (UAS).
Three-dimensional model of Chimney Bluffs, New York along Lake Ontari
Three-dimensional model of Chimney Bluffs, New York along Lake OntariThree-dimensional model of Chimney Bluffs, New York along Lake Ontario created from low-altitude digital images collected from an unmanned aerial system (UAS).

Collecting a core from a reef
Two divers work to collect a long core sample from a coral reef in Florida.
Two divers work to collect a long core sample from a coral reef in Florida.

Coastal bathymetry, St. Thomas, US Virgin Islands, mapped using lidar
Coastal bathymetry, St. Thomas, US Virgin Islands, mapped using lidarCoastal bathymetry, St. Thomas, US Virgin Islands, mapped using lidar and depicted with false-color (purple is deep, orange is shallow). Land areas are depicted with satellite imagery.

Fissure 8 cone and 8-mile lava flow
An aerial view, collected from a USGS UAS, of Hawai‛i’s fissure 8 cone, and the start of the 8-mile lava flow to reach the ocean entry point.
An aerial view, collected from a USGS UAS, of Hawai‛i’s fissure 8 cone, and the start of the 8-mile lava flow to reach the ocean entry point.

Sea level rise scenario model for Dauphin Island, Alabama
Sea level rise scenario model for Dauphin Island, AlabamaThis model shows what Dauphin Island, Alabama, may look like under moderate storms but with increasing rates of sea level rise (Passeri and others, 2018).
Sea level rise scenario model for Dauphin Island, Alabama
Sea level rise scenario model for Dauphin Island, AlabamaThis model shows what Dauphin Island, Alabama, may look like under moderate storms but with increasing rates of sea level rise (Passeri and others, 2018).

USGS aerial imaging mapping team
USGS unmanned aerial system (uas) mapping team on the beach in Dauphin Island, Alabama
USGS unmanned aerial system (uas) mapping team on the beach in Dauphin Island, Alabama

Perspective lidar view of coastal bathymetry at St. Thomas, USVI
Perspective lidar view of coastal bathymetry at St. Thomas, USVIPerspective view of coastal bathymetry looking onshore, St. Thomas, US Virgin Islands, mapped using lidar and depicted with false-color, showing detailed submerged features, including coral reefs.

PCMSC vessel San Lorenzo
USGS Pacific Coastal and Marine Science Center's research vessel R/V San Lorenzo.
USGS Pacific Coastal and Marine Science Center's research vessel R/V San Lorenzo.

PCMSC vessel San Lorenzo at sunset
Sun sets on Whiskeytown Lake with PCMSC's vessel San Lorenzo in foreground.
Sun sets on Whiskeytown Lake with PCMSC's vessel San Lorenzo in foreground.

Ready to dive in Yucatan Peninsula
USGS personnel preparing to dive in Yucatan Peninsula.
USGS personnel preparing to dive in Yucatan Peninsula.

Collecting water samples in Yucatan Peninsula, Mexico
Collecting water samples in Yucatan Peninsula, MexicoCollecting water samples in Yucatan Peninsula, Mexico.
Collecting water samples in Yucatan Peninsula, Mexico
Collecting water samples in Yucatan Peninsula, MexicoCollecting water samples in Yucatan Peninsula, Mexico.

SWATHplus in the water
The SWATHplus is a 234 kHz interferometric bathymetric survey tool for surveys in water depths from 1 to 200 meters.
The SWATHplus is a 234 kHz interferometric bathymetric survey tool for surveys in water depths from 1 to 200 meters.

Tulum, Mexico jungle panorama
Tulum, Mexico jungle panorama

Tulum, Mexico hike through the jungle
Hike through the jungle in Tulum, Mexico
Hike through the jungle in Tulum, Mexico

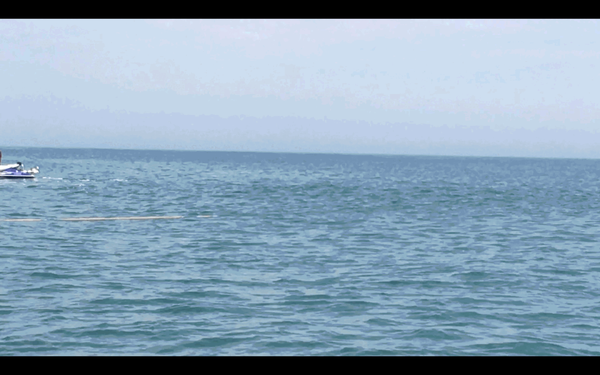
What the skipper sees
Looking through the windshield of USGS Pacific Coastal and Marine Science Center's boat San Lorenzo under pristine field conditions.
Looking through the windshield of USGS Pacific Coastal and Marine Science Center's boat San Lorenzo under pristine field conditions.

Dr. Christina Kellogg loads coral samples for DNA extraction
Dr. Christina Kellogg loads coral samples for DNA extractionSPCMSC Research Microbiologist Christina Kellogg loading coral samples into an automated DNA extraction instrument for processing.
Dr. Christina Kellogg loads coral samples for DNA extraction
Dr. Christina Kellogg loads coral samples for DNA extractionSPCMSC Research Microbiologist Christina Kellogg loading coral samples into an automated DNA extraction instrument for processing.