
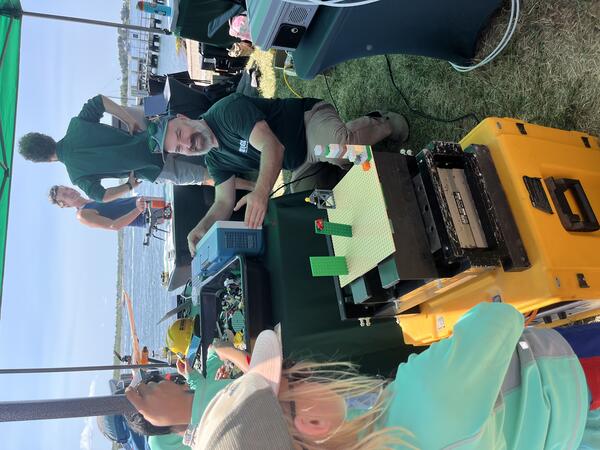
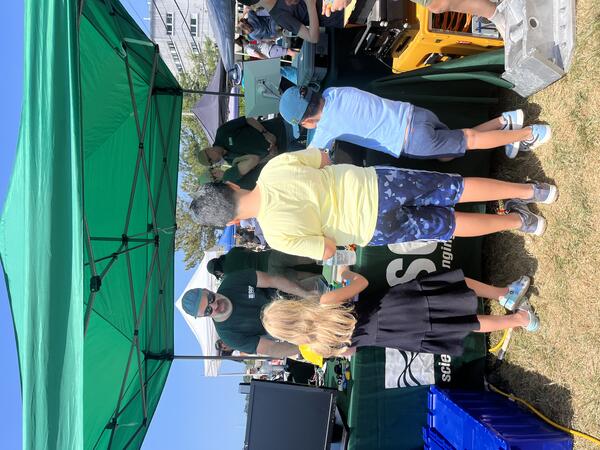
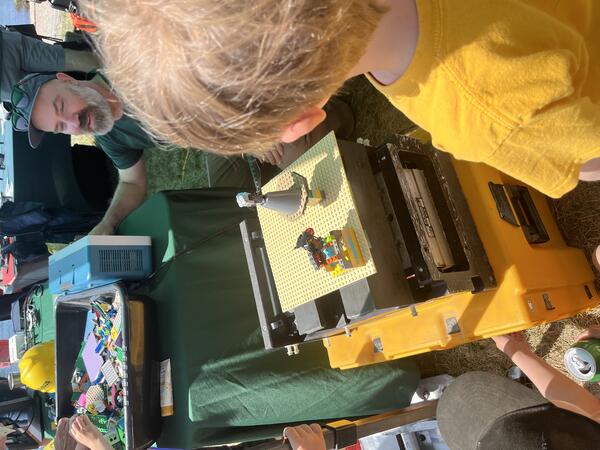
Anxiously waiting to see how the Lego structure does on the shake table! We setup a shake table that moves in different directions, at varying frequencies to demonstrate the power of earthquakes. People built structures out of Legos to put on the shake table to test how buildings, bridges, and other infrastructure would behave during a real seismic event.
Images
Coastal and Marine Hazards and Resources Program images.
Filter Total Items: 2415
2025 Woods Hole Science Stroll
Anxiously waiting to see how the Lego structure does on the shake table! We setup a shake table that moves in different directions, at varying frequencies to demonstrate the power of earthquakes. People built structures out of Legos to put on the shake table to test how buildings, bridges, and other infrastructure would behave during a real seismic event.
2025 Woods Hole Science Stroll
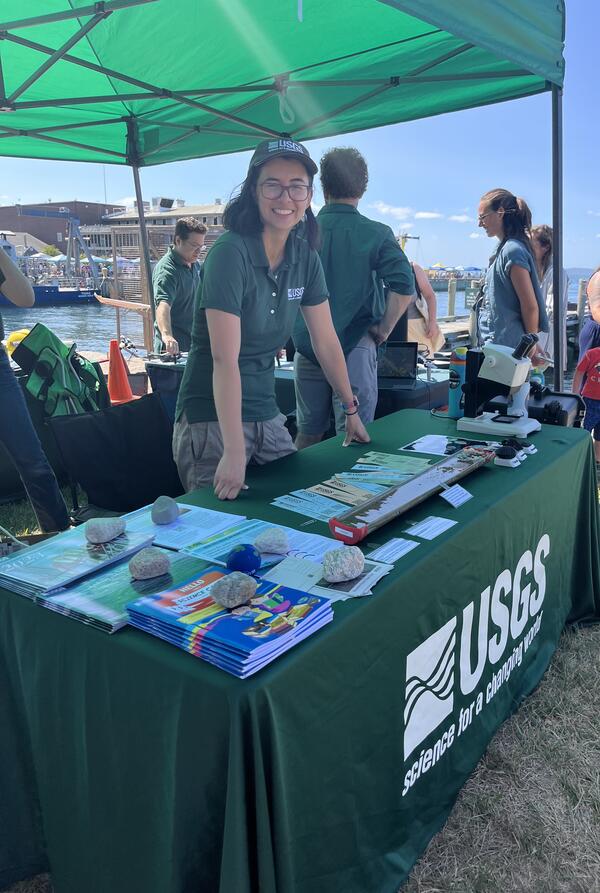
Jin-Si Over at the 2025 Woods Hole Science Stroll on August 9, 2025. During this free event, a variety of booths line the streets, docks, and Waterfront Park to deliver hands-on science activities, games, demonstrations, and more to visitors of all ages.
Jin-Si Over at the 2025 Woods Hole Science Stroll on August 9, 2025. During this free event, a variety of booths line the streets, docks, and Waterfront Park to deliver hands-on science activities, games, demonstrations, and more to visitors of all ages.
2025 Woods Hole Science Stroll
Jin-Si Over at the 2025 Woods Hole Science Stroll on August 9, 2025. During this free event, a variety of booths line the streets, docks, and Waterfront Park to deliver hands-on science activities, games, demonstrations, and more to visitors of all ages.
Jin-Si Over at the 2025 Woods Hole Science Stroll on August 9, 2025. During this free event, a variety of booths line the streets, docks, and Waterfront Park to deliver hands-on science activities, games, demonstrations, and more to visitors of all ages.
2025 Woods Hole Science Stroll
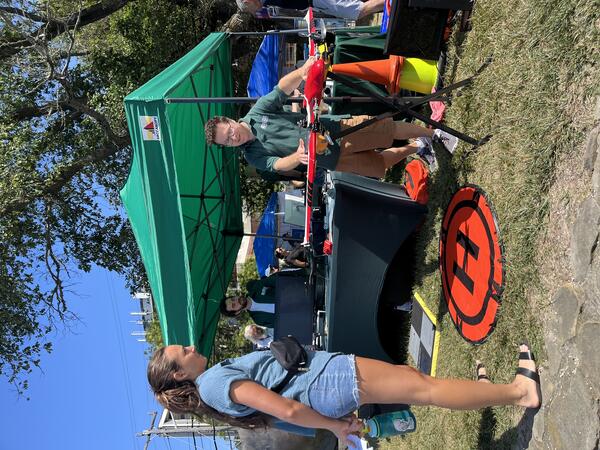
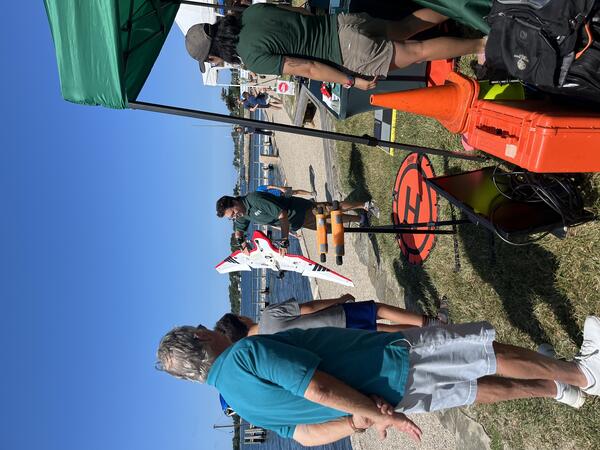
Seth Ackerman showing drones to Science Stroll attendees. The Aerial Imaging and Mapping Group showcased uncrewed aircraft system technology (drones) of all sizes and talked about how they’re used to map short- and long-term changes in coastal landscapes. The group also flew one of the drones to demonstrate how they’re piloted.
Seth Ackerman showing drones to Science Stroll attendees. The Aerial Imaging and Mapping Group showcased uncrewed aircraft system technology (drones) of all sizes and talked about how they’re used to map short- and long-term changes in coastal landscapes. The group also flew one of the drones to demonstrate how they’re piloted.
2025 Woods Hole Science Stroll
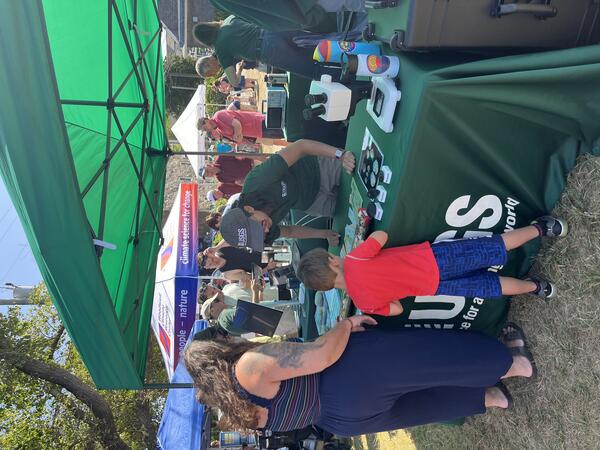
Jin-Si Over talking to an attendee about foraminifera, tiny microfossils that live in marine environments. Scientists at the USGS use foraminifera to determine the age of sediment found many meters below the seafloor and to learn more about past climate conditions.
Jin-Si Over talking to an attendee about foraminifera, tiny microfossils that live in marine environments. Scientists at the USGS use foraminifera to determine the age of sediment found many meters below the seafloor and to learn more about past climate conditions.
2025 Woods Hole Science Stroll
Zafer Defne discussing COAWST, a modeling system that allows many sophisticated models to feedback to one another to accurately simulate physical storm processes.
Zafer Defne discussing COAWST, a modeling system that allows many sophisticated models to feedback to one another to accurately simulate physical storm processes.
2025 Woods Hole Science Stroll
Eric Moore setup a shake table that moves in different directions, at varying frequencies to demonstrate the power of earthquakes. People built structures out of Legos to put on the shake table to test how buildings, bridges, and other infrastructure would behave during a real seismic event.
Eric Moore setup a shake table that moves in different directions, at varying frequencies to demonstrate the power of earthquakes. People built structures out of Legos to put on the shake table to test how buildings, bridges, and other infrastructure would behave during a real seismic event.
2025 Woods Hole Science Stroll
Marie Bartlett at the 2025 Woods Hole Science Stroll on August 9, 2025. During this free event, a variety of booths line the streets, docks, and Waterfront Park to deliver hands-on science activities, games, demonstrations, and more to visitors of all ages.
Marie Bartlett at the 2025 Woods Hole Science Stroll on August 9, 2025. During this free event, a variety of booths line the streets, docks, and Waterfront Park to deliver hands-on science activities, games, demonstrations, and more to visitors of all ages.
2025 Woods Hole Science Stroll
Brita Jessen and Eric Moore at the earthquake station at the 2025 Woods Hole Science Stroll on August 9, 2025. We setup a shake table that moves in different directions, at varying frequencies to demonstrate the power of earthquakes.
Brita Jessen and Eric Moore at the earthquake station at the 2025 Woods Hole Science Stroll on August 9, 2025. We setup a shake table that moves in different directions, at varying frequencies to demonstrate the power of earthquakes.
2025 Woods Hole Science Stroll
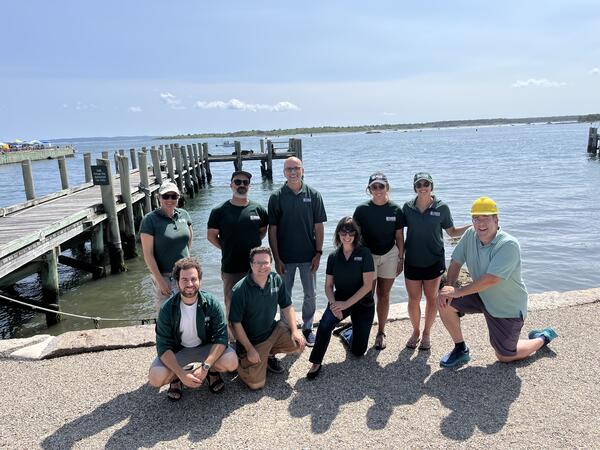
USGS at the 2025 Woods Hole Science Stroll on August 9, 2025! This year's participants included Meagan Eagle, Eric Moore, Zafer Defne, Marie Bartlett, Sara Ernst, Amit Millo, Seth Ackerman, Brita Jessen, and Alfredo Aretxabaleta.
USGS at the 2025 Woods Hole Science Stroll on August 9, 2025! This year's participants included Meagan Eagle, Eric Moore, Zafer Defne, Marie Bartlett, Sara Ernst, Amit Millo, Seth Ackerman, Brita Jessen, and Alfredo Aretxabaleta.
2025 Woods Hole Science Stroll
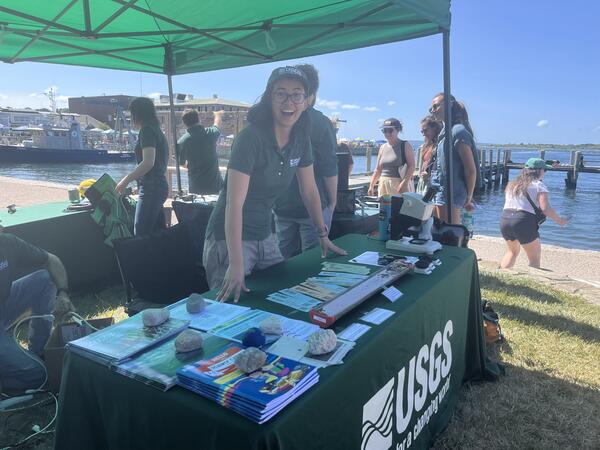
Jin-Si Over at the 2025 Woods Hole Science Stroll on August 9, 2025. During this free event, a variety of booths line the streets, docks, and Waterfront Park to deliver hands-on science activities, games, demonstrations, and more to visitors of all ages.
Jin-Si Over at the 2025 Woods Hole Science Stroll on August 9, 2025. During this free event, a variety of booths line the streets, docks, and Waterfront Park to deliver hands-on science activities, games, demonstrations, and more to visitors of all ages.
2025 Woods Hole Science Stroll
Jin-Si Over at the 2025 Woods Hole Science Stroll on August 9, 2025. During this free event, a variety of booths line the streets, docks, and Waterfront Park to deliver hands-on science activities, games, demonstrations, and more to visitors of all ages.
Jin-Si Over at the 2025 Woods Hole Science Stroll on August 9, 2025. During this free event, a variety of booths line the streets, docks, and Waterfront Park to deliver hands-on science activities, games, demonstrations, and more to visitors of all ages.
2025 Woods Hole Science Stroll
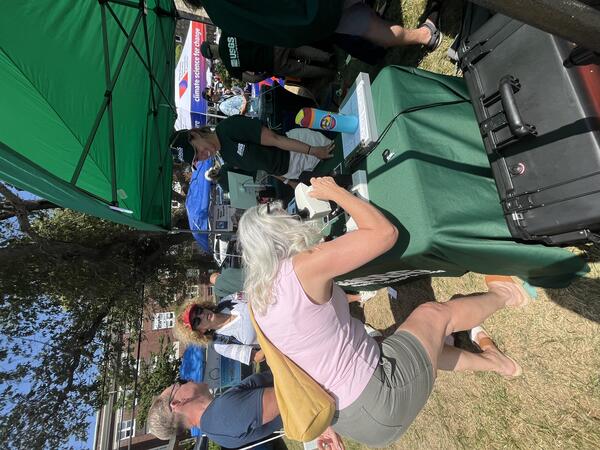
Enjoying the microscope station where visitors could look at foraminifera, tiny microfossils that live in marine environments. Scientists at the USGS use foraminifera to determine the age of sediment found many meters below the seafloor and to learn more about past climate conditions.
Enjoying the microscope station where visitors could look at foraminifera, tiny microfossils that live in marine environments. Scientists at the USGS use foraminifera to determine the age of sediment found many meters below the seafloor and to learn more about past climate conditions.
2025 Woods Hole Science Stroll
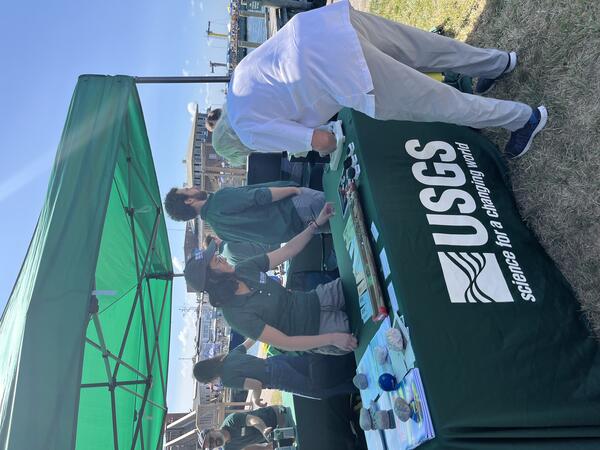
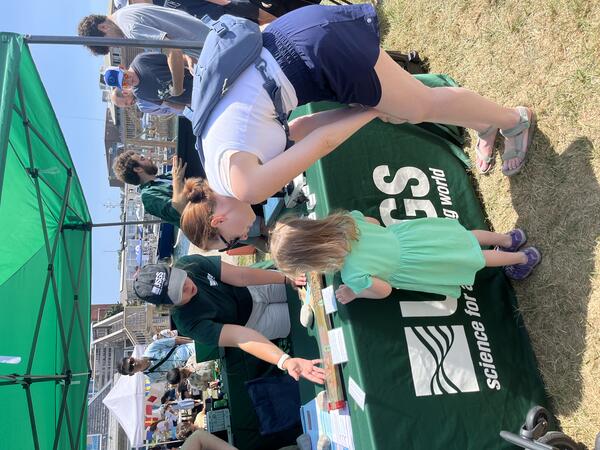
Marie Bartlett showing off our replica sediment core at the Woods Hole Science Stroll.
Marie Bartlett showing off our replica sediment core at the Woods Hole Science Stroll.
2025 Woods Hole Science Stroll
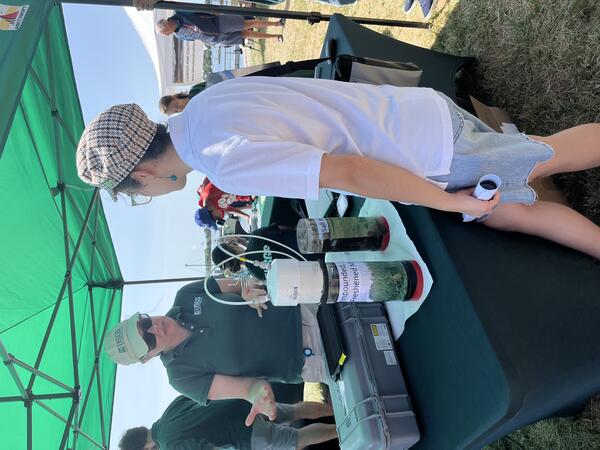
Meagan Eagle used a gas analyzer and respiration chamber to demonstrate the role of salt marshes in carbon sequestration.
Meagan Eagle used a gas analyzer and respiration chamber to demonstrate the role of salt marshes in carbon sequestration.
2025 Woods Hole Science Stroll
Seth Ackerman showing off one of our drones at the 2025 Woods Hole Science Stroll on August 9, 2025. During this free event, a variety of booths line the streets, docks, and Waterfront Park to deliver hands-on science activities, games, demonstrations, and more to visitors of all ages.
Seth Ackerman showing off one of our drones at the 2025 Woods Hole Science Stroll on August 9, 2025. During this free event, a variety of booths line the streets, docks, and Waterfront Park to deliver hands-on science activities, games, demonstrations, and more to visitors of all ages.
2025 Woods Hole Science Stroll
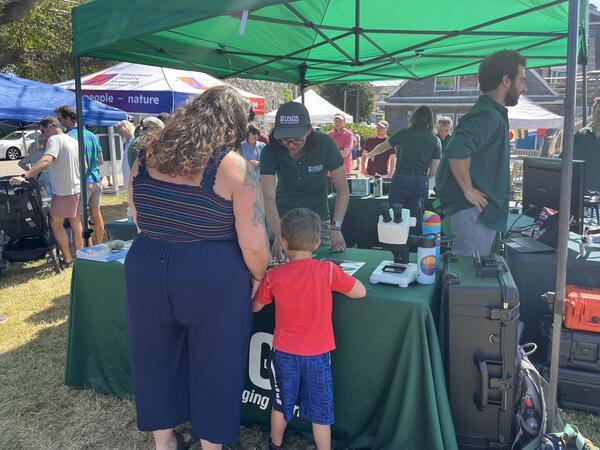
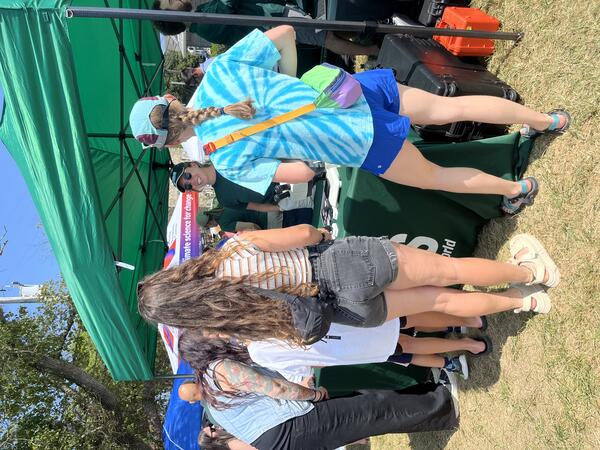
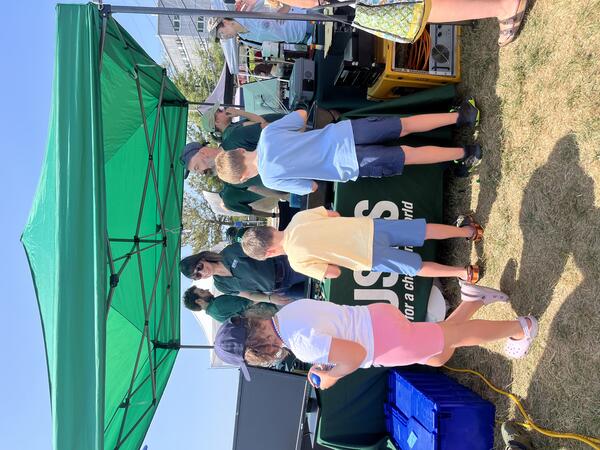
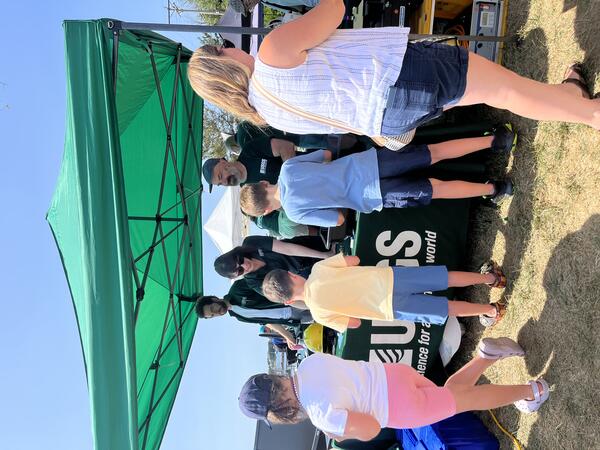
The USGS booth at the 2025 Woods Hole Science Stroll on August 9, 2025. During this free event, a variety of booths line the streets, docks, and Waterfront Park to deliver hands-on science activities, games, demonstrations, and more to visitors of all ages.
The USGS booth at the 2025 Woods Hole Science Stroll on August 9, 2025. During this free event, a variety of booths line the streets, docks, and Waterfront Park to deliver hands-on science activities, games, demonstrations, and more to visitors of all ages.
2025 Woods Hole Science Stroll
We setup a shake table that moves in different directions, at varying frequencies to demonstrate the power of earthquakes. People built structures out of Legos to put on the shake table to test how buildings, bridges, and other infrastructure would behave during a real seismic event.
We setup a shake table that moves in different directions, at varying frequencies to demonstrate the power of earthquakes. People built structures out of Legos to put on the shake table to test how buildings, bridges, and other infrastructure would behave during a real seismic event.
2025 Woods Hole Science Stroll
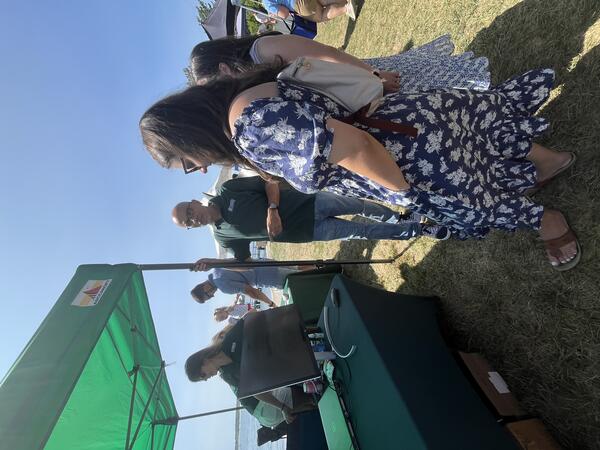
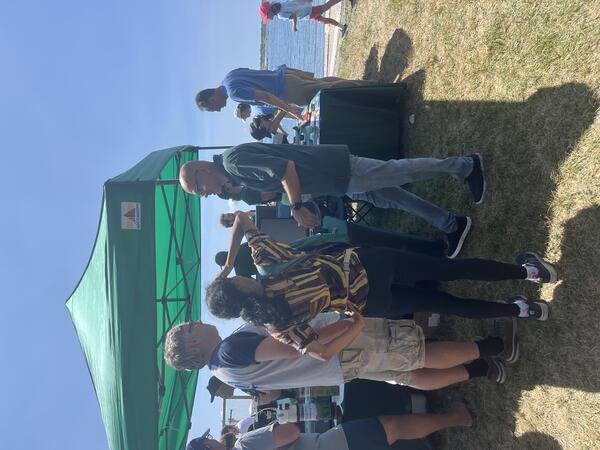
Zafer Defne discussed discussed ocean and coastal dynamics with attendees and provided details about the COAWST modeling system. The COAWST model allows many sophisticated models to work together to accurately simulate physical processes during a storm.
Zafer Defne discussed discussed ocean and coastal dynamics with attendees and provided details about the COAWST modeling system. The COAWST model allows many sophisticated models to work together to accurately simulate physical processes during a storm.
Curl Curl Beach, New South Wales, Australia
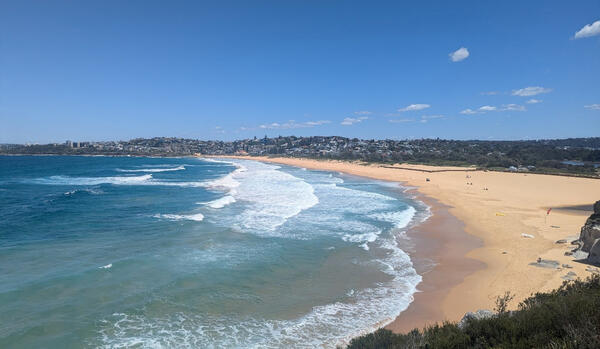
Curl Curl Beach, New South Wales, Australia, the test site used in the collaborative shoreline modeling workshop ShoreShop2.0, from the study Benchmarking shoreline prediction models over multi-decadal timescales.
Curl Curl Beach, New South Wales, Australia, the test site used in the collaborative shoreline modeling workshop ShoreShop2.0, from the study Benchmarking shoreline prediction models over multi-decadal timescales.
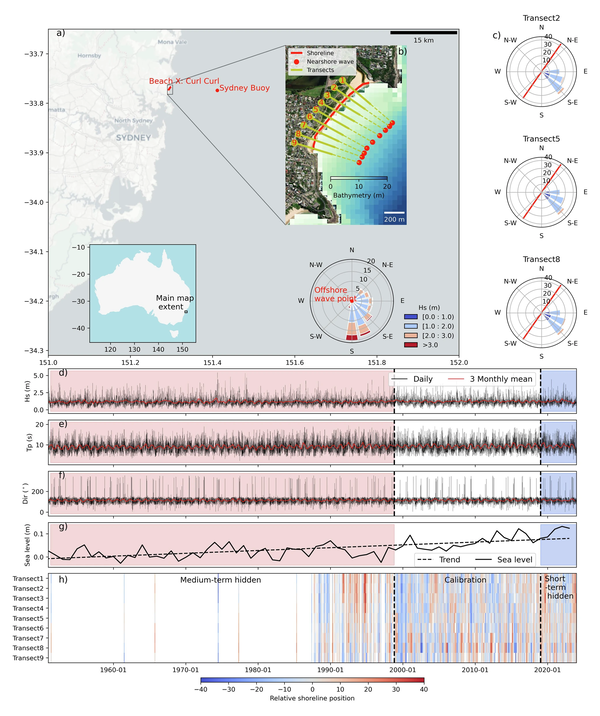
Detailed map of BeachX, Curl Curl Beach, New South Wales, Australia
Detailed map of BeachX, Curl Curl Beach, New South Wales, AustraliaLocation of BeachX. Inset wave rose shows the location and distribution of offshore waves from ERA5. b The detailed map of BeachX (Curl Curl Beach, New South Wales, Australia). The color gradient at the seaside indicates bathymetry. Yellow lines represent transects. Red dots show the location of nearshore waves.