
New Method Developed to Quantify Spatial Extent of Cyanobacterial Blooms
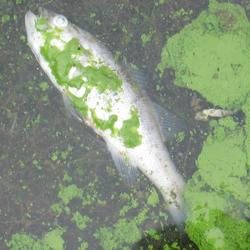
A bloom of cyanobacteria near the shore of Milford Lake, Kansas
This study provides a method for quantifying changes in the spatial extent of cyanobacterial blooms at local and regional scales using remotely sensed data to determine if bloom occurrence and size are increasing or decreasing for inland water resources.

Cyanobacterial blooms are perceived to be increasing globally during the past few decades, but little quantitative information is available regarding the frequency and severity of blooms to substantiate this perception.
Cyanobacterial blooms result when there is rapid growth or accumulation of cyanobacteria. Under conditions that are not yet fully understood, cyanobacteria can produce toxins that pose a range of potential health risks to humans, pets, livestock and wildlife. Cyanobacterial blooms are sometimes mistakenly referred to as "algal blooms" or "harmful algal blooms" because cyanobacteria were historically classified as blue-green algae and cyanobacteria coexist with and function like algae in aquatic systems.
Consistent, repeatable assessment methods are needed to provide information relevant to understanding actual, as compared to perceived, temporal trends in areas already experiencing blooms as well as in regions not yet affected.
In this study, scientists from the U.S. Environmental Protection Agency (USEPA), National Aeronautics and Space Administration (NASA), National Oceanic and Atmospheric Administration (NOAA), and U.S. Geological Survey (USGS) built on previous studies to develop a robust and repeatable method for examining temporal changes in the spatial extent of cyanobacterial blooms over time. The method developed was used to quantify the surface area of cyanobacterial blooms at both local and regional scales.
An assessment method using Medium Resolution Imaging Spectrometer (MERIS) remotely sensed imagery was developed to quantify the surface area extent of cyanobacterial blooms. The method was evaluated using imagery collected over Florida, Ohio, and California between 2008 and 2012, which coincided with the MERIS continuous full resolution acquisition mode. Temporal changes in the spatial extent of the blooms were quantified for each State and individual management districts in Florida to characterize method performance at local and regional scales, and evaluate changing recreational risk based on World Health Organization guidance values for cyanobacterial abundance.
The spatial extent of cyanobacterial blooms increased in Florida between 2008 and 2012, largely due to increases in high-risk bloom areas. California exhibited a slight decrease in cyanobacterial bloom extent, mainly attributed to lakes in northern California between 2008 and 2012. Ohio (excluding Lake Erie), exhibited little change in bloom surface area across all risk categories between 2008 and 2012. With additional time series data provided by recently launched (2016) and future satellite missions, this approach can enable long-term trend assessments. Quantification of changes in bloom frequency and extent over time is essential to understanding the effect of longer term environmental changes on blooms at local, regional, national, and global scales.
This study is part of a larger effort of the USGS Environmental Health Program to provide information that will help resource managers understand how to effectively minimize potential risks to the health of humans and other organisms exposed to cyanotoxins through recreation, drinking water, and other exposure routes. Being able to evaluate if the spatial extent of cyanobacterial blooms is increasing or decreasing over time provides information for targeting efficient resource allocation in areas where the spatial extent of cyanobacterial blooms is increasing.
This study was supported by the NASA Ocean Biology and Biogeochemistry Program/Applied Science Program (proposal NASA 14-SMDUNSOL14-0001), the USEPA, NOAA, and the USGS Toxic Substances Hydrology Program.
Below are other science projects associated with this project.
Toxins and Harmful Algal Blooms Science Team

Algal and Environmental Toxins Research Laboratory — Lawrence, Kansas
Satellite Data Used to Estimate and Rank Cyanobacterial Bloom Magnitude in Florida and Ohio Lakes—Developing Tools to Protect Human and Wildlife Health from Cyanotoxin Exposure

Mixtures of Algal Toxins Present Prior to and After Formation of Visible Algal Blooms—Science to Inform the Timing of Algal Toxin Exposure

Understanding Drivers of Cyanotoxin Production in the Lake Okeechobee Waterway

Understanding Associations between Mussel Productivity and Cyanotoxins in Lake Erie

Comparison of Predicted and Measured Pharmaceutical Concentrations in Rivers

New Method Developed to Quantify Spatial Extent of Cyanobacterial Blooms

Satellite Imagery Used to Measure Algal Bloom Frequency—Steps Toward Understanding Exposure Risk

Cyanobacteria from 2016 Lake Okeechobee Harmful Algal Bloom Photo-Documented

Evaluating Linkages Between Algal Toxins and Human Health
This study provides a method for quantifying changes in the spatial extent of cyanobacterial blooms at local and regional scales using remotely sensed data to determine if bloom occurrence and size are increasing or decreasing for inland water resources.
Cyanobacterial blooms are perceived to be increasing globally during the past few decades, but little quantitative information is available regarding the frequency and severity of blooms to substantiate this perception.
Cyanobacterial blooms result when there is rapid growth or accumulation of cyanobacteria. Under conditions that are not yet fully understood, cyanobacteria can produce toxins that pose a range of potential health risks to humans, pets, livestock and wildlife. Cyanobacterial blooms are sometimes mistakenly referred to as "algal blooms" or "harmful algal blooms" because cyanobacteria were historically classified as blue-green algae and cyanobacteria coexist with and function like algae in aquatic systems.
Consistent, repeatable assessment methods are needed to provide information relevant to understanding actual, as compared to perceived, temporal trends in areas already experiencing blooms as well as in regions not yet affected.
In this study, scientists from the U.S. Environmental Protection Agency (USEPA), National Aeronautics and Space Administration (NASA), National Oceanic and Atmospheric Administration (NOAA), and U.S. Geological Survey (USGS) built on previous studies to develop a robust and repeatable method for examining temporal changes in the spatial extent of cyanobacterial blooms over time. The method developed was used to quantify the surface area of cyanobacterial blooms at both local and regional scales.
An assessment method using Medium Resolution Imaging Spectrometer (MERIS) remotely sensed imagery was developed to quantify the surface area extent of cyanobacterial blooms. The method was evaluated using imagery collected over Florida, Ohio, and California between 2008 and 2012, which coincided with the MERIS continuous full resolution acquisition mode. Temporal changes in the spatial extent of the blooms were quantified for each State and individual management districts in Florida to characterize method performance at local and regional scales, and evaluate changing recreational risk based on World Health Organization guidance values for cyanobacterial abundance.
The spatial extent of cyanobacterial blooms increased in Florida between 2008 and 2012, largely due to increases in high-risk bloom areas. California exhibited a slight decrease in cyanobacterial bloom extent, mainly attributed to lakes in northern California between 2008 and 2012. Ohio (excluding Lake Erie), exhibited little change in bloom surface area across all risk categories between 2008 and 2012. With additional time series data provided by recently launched (2016) and future satellite missions, this approach can enable long-term trend assessments. Quantification of changes in bloom frequency and extent over time is essential to understanding the effect of longer term environmental changes on blooms at local, regional, national, and global scales.
This study is part of a larger effort of the USGS Environmental Health Program to provide information that will help resource managers understand how to effectively minimize potential risks to the health of humans and other organisms exposed to cyanotoxins through recreation, drinking water, and other exposure routes. Being able to evaluate if the spatial extent of cyanobacterial blooms is increasing or decreasing over time provides information for targeting efficient resource allocation in areas where the spatial extent of cyanobacterial blooms is increasing.
This study was supported by the NASA Ocean Biology and Biogeochemistry Program/Applied Science Program (proposal NASA 14-SMDUNSOL14-0001), the USEPA, NOAA, and the USGS Toxic Substances Hydrology Program.
Below are other science projects associated with this project.
Toxins and Harmful Algal Blooms Science Team
Algal and Environmental Toxins Research Laboratory — Lawrence, Kansas
Satellite Data Used to Estimate and Rank Cyanobacterial Bloom Magnitude in Florida and Ohio Lakes—Developing Tools to Protect Human and Wildlife Health from Cyanotoxin Exposure
Mixtures of Algal Toxins Present Prior to and After Formation of Visible Algal Blooms—Science to Inform the Timing of Algal Toxin Exposure
Understanding Drivers of Cyanotoxin Production in the Lake Okeechobee Waterway
Understanding Associations between Mussel Productivity and Cyanotoxins in Lake Erie
Comparison of Predicted and Measured Pharmaceutical Concentrations in Rivers
New Method Developed to Quantify Spatial Extent of Cyanobacterial Blooms
Satellite Imagery Used to Measure Algal Bloom Frequency—Steps Toward Understanding Exposure Risk
Cyanobacteria from 2016 Lake Okeechobee Harmful Algal Bloom Photo-Documented