
An infographic that highlights the ways that the Earth Mapping Resources Initiative (Earth MRI) gathers multiple types of data, including: topography, geology, geochemistry, geophysics, borehole information, hyperspectral imagery, mine waste and more.
Images
Mineral Resources Program images.
Filter Total Items: 268
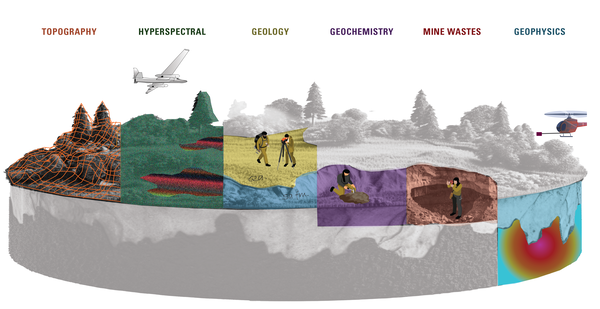
Earth MRI Methods and Data Infographic
An infographic that highlights the ways that the Earth Mapping Resources Initiative (Earth MRI) gathers multiple types of data, including: topography, geology, geochemistry, geophysics, borehole information, hyperspectral imagery, mine waste and more.
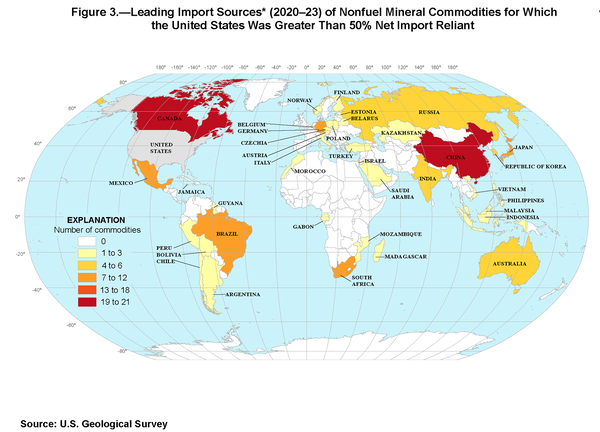
US Minerals Net Import Reliance 2020-2023
The United States continues to rely on foreign sources for some raw and processed minerals materials, including some critical minerals. This map shows the countries that supply nonfuel mineral commodities for which the United States was greater than 50% net import reliant from 2020-2023.
The United States continues to rely on foreign sources for some raw and processed minerals materials, including some critical minerals. This map shows the countries that supply nonfuel mineral commodities for which the United States was greater than 50% net import reliant from 2020-2023.
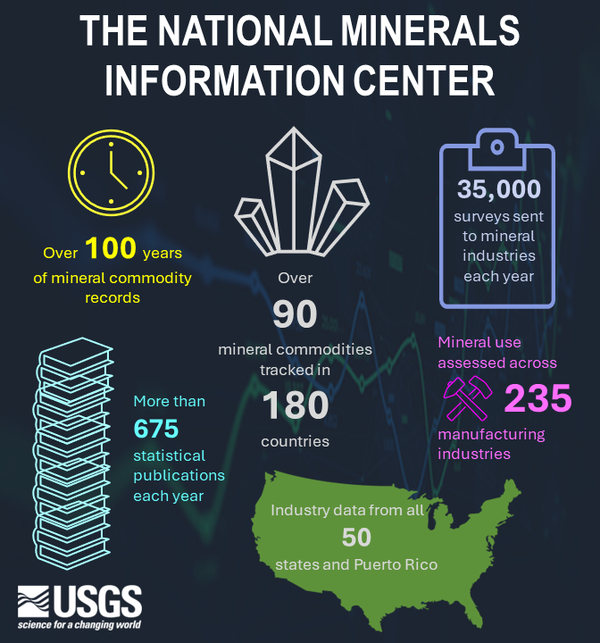
National Minerals Information Center By-the-Numbers
National Minerals Information Center By-the-NumbersThe National Minerals Information Center:
National Minerals Information Center By-the-Numbers
National Minerals Information Center By-the-NumbersThe National Minerals Information Center:

Schematic Diagram of Water Flow for Conventional Flotation Processing of Copper Ores (Bleiwas, 2012)
Schematic Diagram of Water Flow for Conventional Flotation Processing of Copper Ores (Bleiwas, 2012)Schematic diagram of water flow for conventional flotation processing of copper ores from Bleiwas, D.I., 2012, Estimated water requirements for the conventional flotation of copper ores: U.S. Geological Survey Open-File Report 2012–1089, 13 p., available at https://pubs.usgs.gov/publication/ofr20121089


Earth MRI Mineral Systems Map Colorful
Map showing the 23 mineral systems identified by the Mineral Resources Program and Earth Mapping Resources Initiative (Earth MRI)
Map showing the 23 mineral systems identified by the Mineral Resources Program and Earth Mapping Resources Initiative (Earth MRI)


Earth MRI Mineral Systems Map Gray
Map showing areas within the 23 mineral systems identified by the Mineral Resources Program and Earth Mapping Resources Initiative (Earth MRI).
Map showing areas within the 23 mineral systems identified by the Mineral Resources Program and Earth Mapping Resources Initiative (Earth MRI).

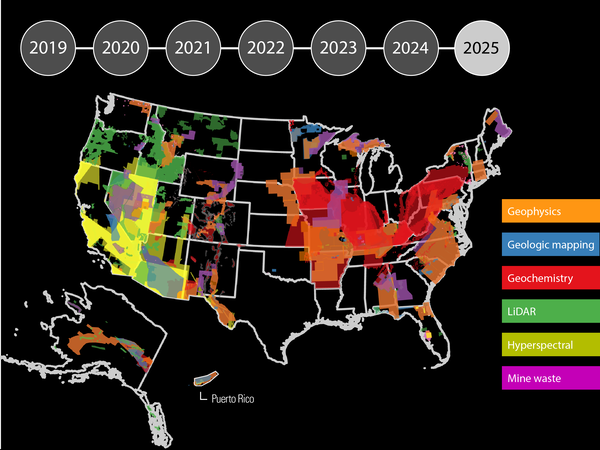
Earth MRI First Five Years Accomplishments
Earth MRI: The First Five Years
The Earth Mapping Resources Initiative (Earth MRI) is modernizing the Nation’s mapping and geoscience data, benefitting regions, states and local communities.
By the Numbers:
40 States and Territories partnered with Earth MRI
Earth MRI: The First Five Years
The Earth Mapping Resources Initiative (Earth MRI) is modernizing the Nation’s mapping and geoscience data, benefitting regions, states and local communities.
By the Numbers:
40 States and Territories partnered with Earth MRI


Mineral Supply Risk Analysis for the 2022 List of Critical Minerals Infographic
Mineral Supply Risk Analysis for the 2022 List of Critical Minerals InfographicMineral Supply Risk Analysis for the 2022 List of Critical Minerals
The USGS leads the government in developing the List of Critical Minerals, using a data-driven methodology to assess mineral supply risk.
Critical minerals are essential the Nation’s economy and security, and have supply chains vulnerable to disruption.

Pie Chart Showing Relative Amounts of Copper Produced in Leading Copper Producing States in 2019
Pie Chart Showing Relative Amounts of Copper Produced in Leading Copper Producing States in 2019Pie chart showing relative amounts of copper produced by leading copper producing states in the U.S. in 2019 (derived from data in Flanagan, D.M., 2019, Copper, in Metals and minerals: U.S. Geological Survey Minerals Yearbook 2019, v. 1, p. 20.1-20.30.

Porphyry.Copper.Map_.John_.and_.Others.2010.jpg
Global map showing locations of porphyry copper deposits from John, D.A., Ayuso, R.A., Barton, M.D., Blakely, R.J., Bodnar, R.J., Dilles, J.H., Gray, Floyd, Graybeal, F.T., Mars, J.C., McPhee, D.K., Seal, R.R., Taylor, R.D., and Vikre, P.G., 2010, Porphyry copper deposit model, chap. B of Mineral deposit models for resource assessment: U.S.
Global map showing locations of porphyry copper deposits from John, D.A., Ayuso, R.A., Barton, M.D., Blakely, R.J., Bodnar, R.J., Dilles, J.H., Gray, Floyd, Graybeal, F.T., Mars, J.C., McPhee, D.K., Seal, R.R., Taylor, R.D., and Vikre, P.G., 2010, Porphyry copper deposit model, chap. B of Mineral deposit models for resource assessment: U.S.

Copper.production.by_.US_.state_.pie_.chart_.2020.jpg
Copper.production.by_.US_.state_.pie_.chart_.2020.jpgPie chart showing copper production in leading copper producing U.S. states in 2020 by Eric Anderson of the Geology, Geophysics, and Geochemistry Science Center, August 2024
Copper.production.by_.US_.state_.pie_.chart_.2020.jpg
Copper.production.by_.US_.state_.pie_.chart_.2020.jpgPie chart showing copper production in leading copper producing U.S. states in 2020 by Eric Anderson of the Geology, Geophysics, and Geochemistry Science Center, August 2024

Copper.mine_.locations.lower_.colorado.river_.basin_.2024.jpg
Copper.mine_.locations.lower_.colorado.river_.basin_.2024.jpgMap showing locations of copper producing mines in the Lower Colorado River Basin, produced by Eric Anderson of the Geology, Geophysics, and Geochemistry Science Center on August 19, 2024.

Critical.Mineral.Commodities.in_.Renewable.Energy.jpg
Critical.Mineral.Commodities.in_.Renewable.Energy.jpgInfographic about critical mineral commodities use in renewable energy, published online by the USGS Office of Communications and Publishing in June 2019.
Critical.Mineral.Commodities.in_.Renewable.Energy.jpg
Critical.Mineral.Commodities.in_.Renewable.Energy.jpgInfographic about critical mineral commodities use in renewable energy, published online by the USGS Office of Communications and Publishing in June 2019.