
The life cycle of molybdenum, from primary material to downstream products.
Images
Mineral Resources Program images.
Filter Total Items: 268
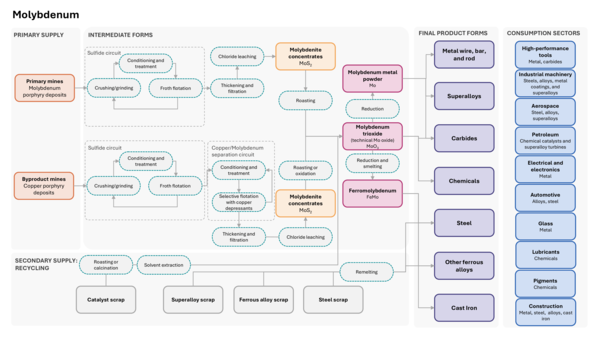
The Life Cycle of Molybdenum
The life cycle of molybdenum, from primary material to downstream products.

NASA’s ER‑2 high‑altitude research aircraft touches down in Colorado Springs May 11, 2026
NASA’s ER‑2 high‑altitude research aircraft touches down in Colorado Springs May 11, 2026NASA’s ER‑2 high‑altitude research aircraft touches down in Colorado Springs May 11, 2026, after completing a hyperspectral survey flight for the joint USGS–NASA effort to map critical minerals across the western United States.
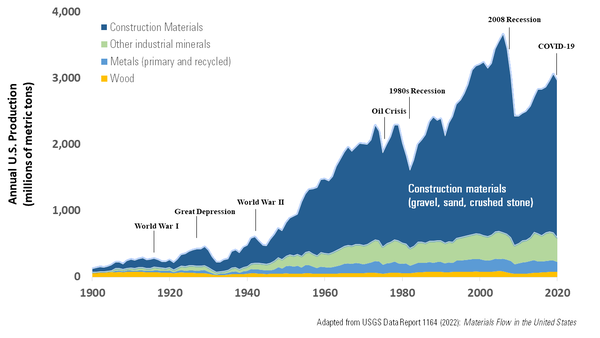
Annual U.S. production of materials over time
Graph of U.S. production (in millions of metric tons) of materials from 1900 to 2020, adapted from Materials flow in the United States—A global context, 1900–2020.
Graph of U.S. production (in millions of metric tons) of materials from 1900 to 2020, adapted from Materials flow in the United States—A global context, 1900–2020.
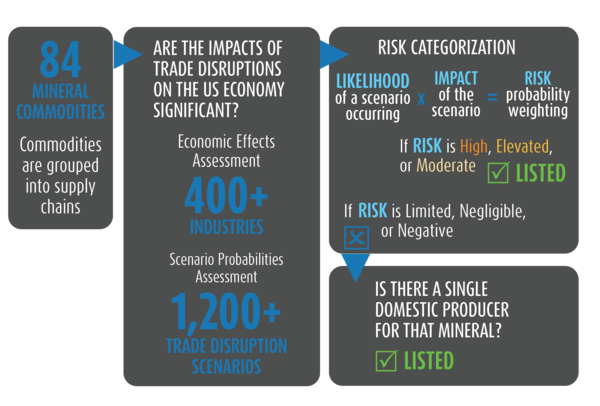
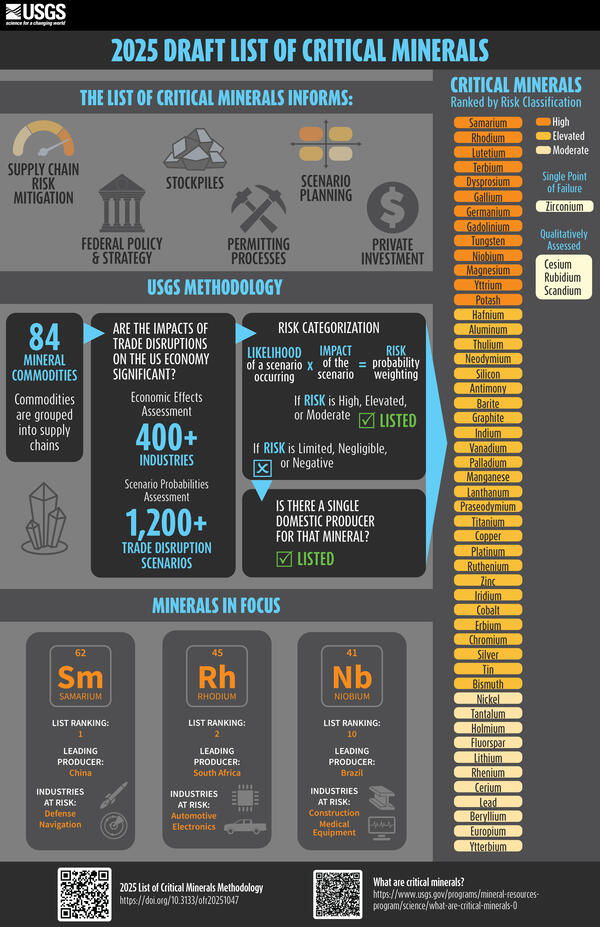
2025 List of Critical Minerals Methodology Infographic
2025 List of Critical Minerals Methodology InfographicInfographic flowchart summarizing the USGS methodology for technical input to the 2025 List of Critical Minerals. The full methodology is found here: Methodology and technical input for the 2025 U.S.
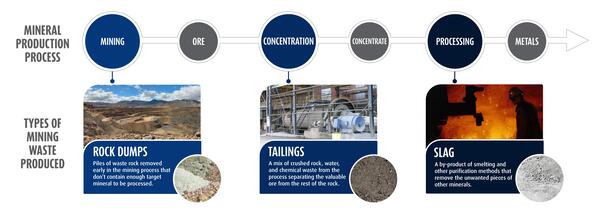
How mine waste is made
Mine wastes are produced at each stage of mineral production - mine wastes that can contain critical and other minerals, and could potentially be reprocessed. This infographic shows three kinds of mine wastes produced during mineral production, and a sense of scale of how much waste is produced:
Mine wastes are produced at each stage of mineral production - mine wastes that can contain critical and other minerals, and could potentially be reprocessed. This infographic shows three kinds of mine wastes produced during mineral production, and a sense of scale of how much waste is produced:
USGS MRP Coloring Page Cassiterite
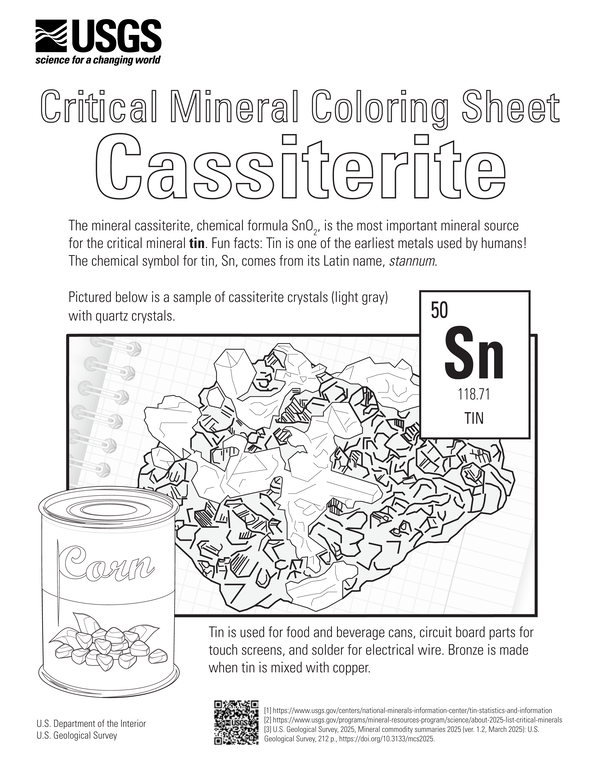
USGS Mineral Resources Program coloring page for cassiterite and the critical mineral tin.
The mineral cassiterite, chemical formula SnO2, is the most important mineral source for the critical mineral tin. Fun facts: tin is one of the earliest metals used by humans! The chemical symbol for tin, Sn, comes from its Latin name, stannum.
USGS MRP Color by Number: Graphite
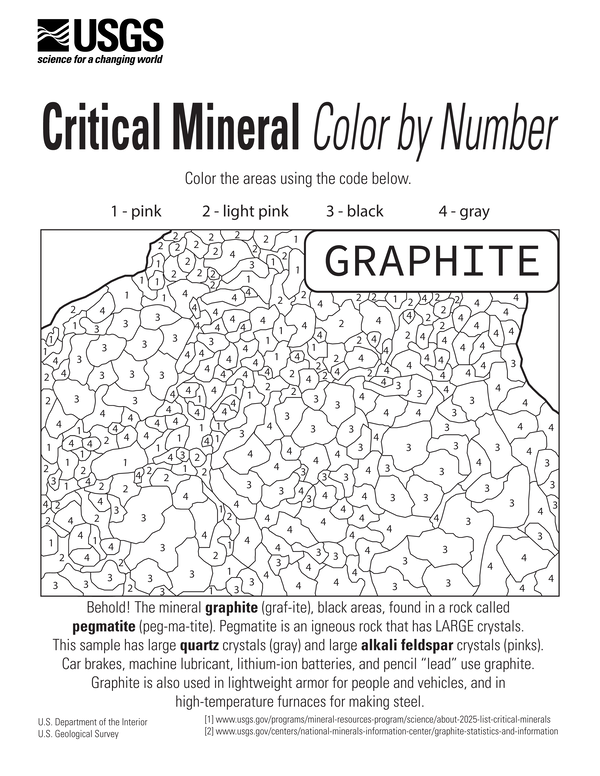
USGS Mineral Resources Program color by number for the critical mineral graphite.
USGS Mineral Resources Program color by number for the critical mineral graphite.
USGS MRP Coloring Page Galena
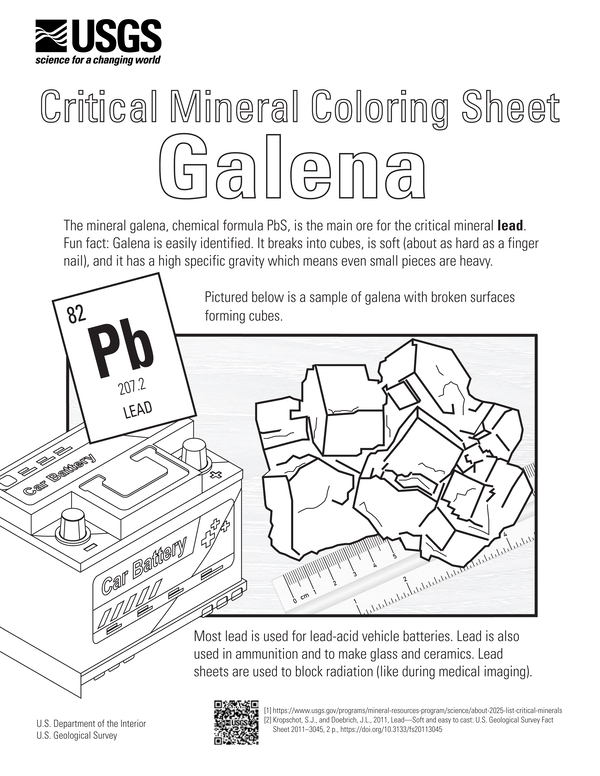
USGS Mineral Resources Program coloring page for the mineral galena and the critical mineral lead.
USGS Mineral Resources Program coloring page for the mineral galena and the critical mineral lead.
USGS MRP Critical Mineral Word Scramble Puzzle: Tantalum
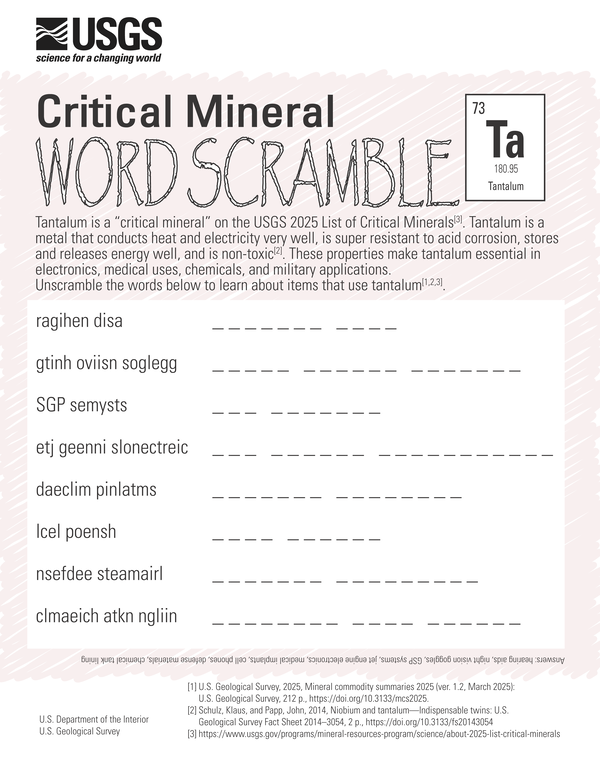
USGS MRP Critical Mineral Word Scramble Puzzle: TantalumUSGS Mineral Resources Program Critical Mineral Word Scramble Puzzle: Tantalum
USGS MRP Critical Mineral Word Scramble Puzzle: Tantalum
USGS MRP Critical Mineral Word Scramble Puzzle: TantalumUSGS Mineral Resources Program Critical Mineral Word Scramble Puzzle: Tantalum
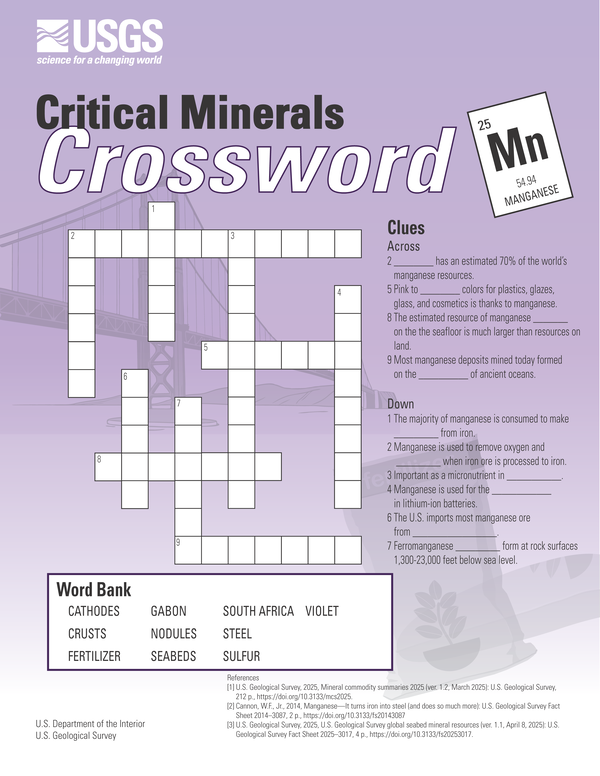
USGS MRP Critical Mineral Crossword Puzzle: Manganese
USGS MRP Critical Mineral Crossword Puzzle: ManganeseCritical Mineral Crossword Puzzle: Manganese
Manganese is listed as a "critical mineral". Learn about where we get manganese and how we use it by solving the crossword puzzle clues!
More information:
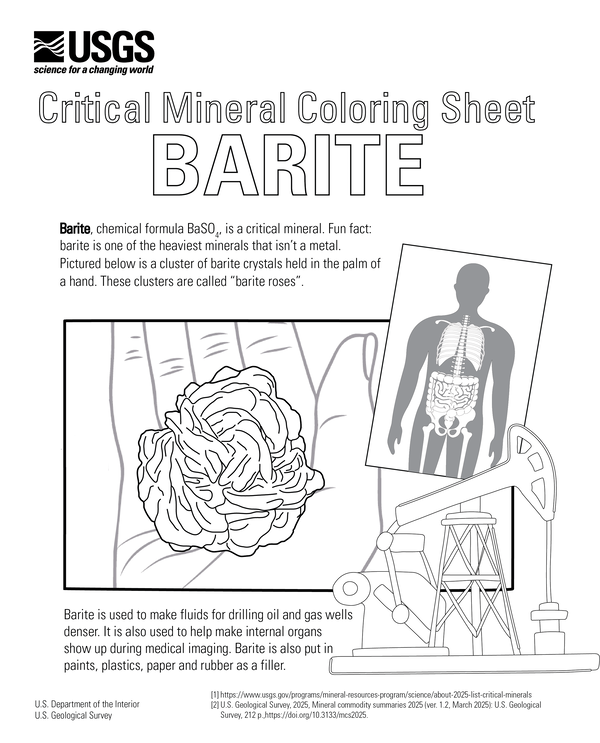
USGS MRP Coloring Page Barite
USGS Mineral Resources Program coloring page for the critical mineral barite.
Barite, chemical formula BaSO4, is a critical mineral. Fun fact: barite is one of the heaviest minerals that isn't a metal.
USGS Mineral Resources Program coloring page for the critical mineral barite.
Barite, chemical formula BaSO4, is a critical mineral. Fun fact: barite is one of the heaviest minerals that isn't a metal.
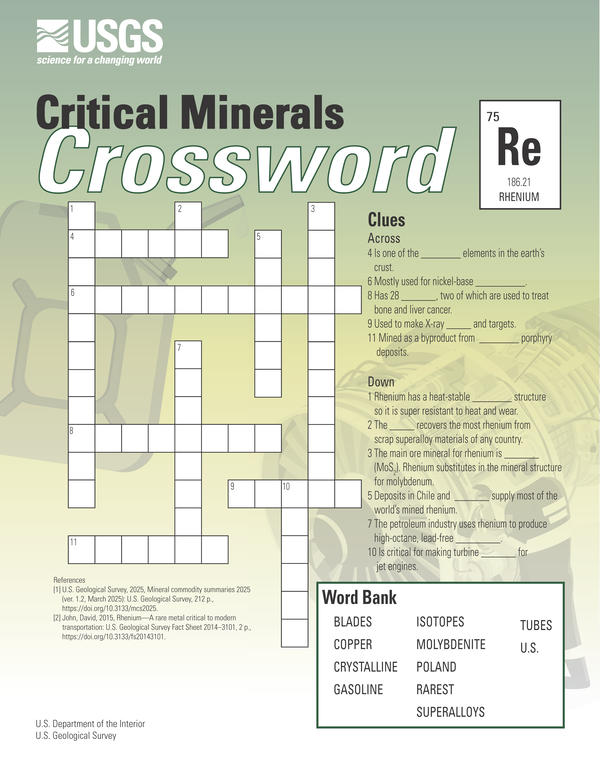
USGS MRP Critical Mineral Crossword Puzzle: Rhenium
USGS MRP Critical Mineral Crossword Puzzle: RheniumCritical Mineral Crossword Puzzle: Rhenium.
Rhenium is listed as "critical mineral". Learn about where we get rhenium and how we use it by solving the crossword puzzle clues!
More information
USGS MRP Critical Mineral Crossword Puzzle: Rhenium
USGS MRP Critical Mineral Crossword Puzzle: RheniumCritical Mineral Crossword Puzzle: Rhenium.
Rhenium is listed as "critical mineral". Learn about where we get rhenium and how we use it by solving the crossword puzzle clues!
More information
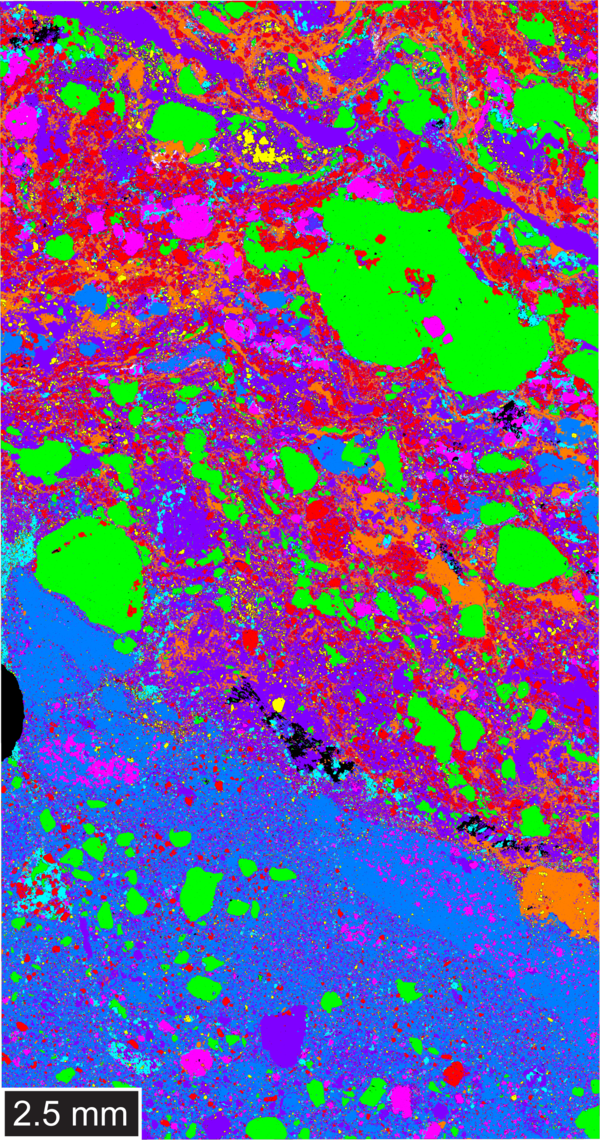
False color phase map of host breccia from Hicks Dome, Illinois
False color phase map of host breccia from Hicks Dome, IllinoisFalse color phase map of host breccia sample from Hicks Dome, Illinois. Image includes the phases of: pyrite, fluorite, quartz, barite-celestite, brookite-anatase, fluorapatite, illite, and dolomite-calcite with Mg-enrichment.
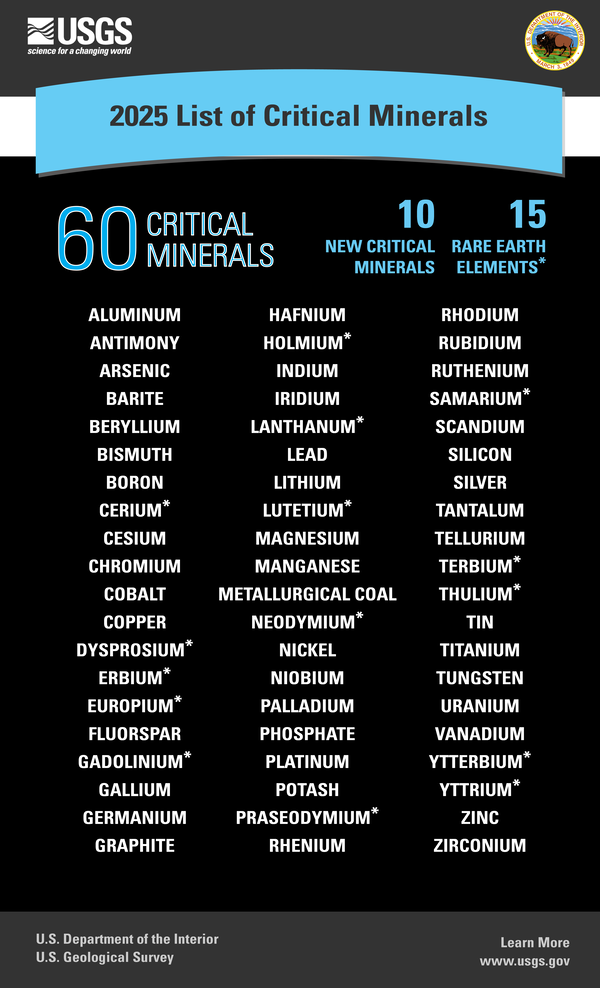
2025 List of Critical Minerals
2025 List of Critical Minerals
The 2025 List of Critical Minerals includes 60 critical minerals. 50 of these were also included on the 2022 List of Critical Minerals, and 10 are new. There are 15 rare earth elements included on the List.
2025 List of Critical Minerals
The 2025 List of Critical Minerals includes 60 critical minerals. 50 of these were also included on the 2022 List of Critical Minerals, and 10 are new. There are 15 rare earth elements included on the List.
2025 Draft List of Critical Minerals
The List of Critical Minerals Informs:
-
Supply chain risk mitigation
-
Federal policy and strategy
-
Stockpiles
-
Permitting Processes
The List of Critical Minerals Informs:
-
Supply chain risk mitigation
-
Federal policy and strategy
-
Stockpiles
-
Permitting Processes
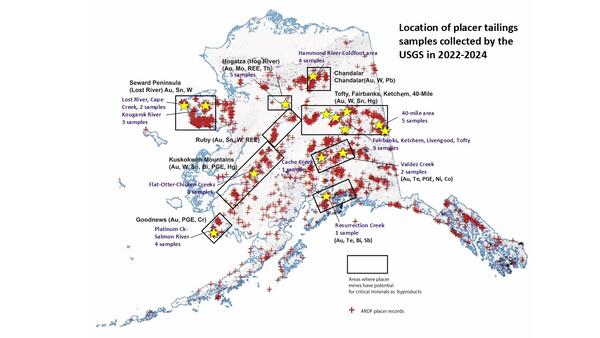
Alaska locations of USGS placer tailings sampling sites
Alaska locations of USGS placer tailings sampling sitesMap showing locations of placer mines in the Alaska Resource Data File (ARDF, red crosses), primary mineral districts that contain targeted critical minerals (black boxes) and locations that were sampled by the USGS in 2022 through 2024 (yellow stars).
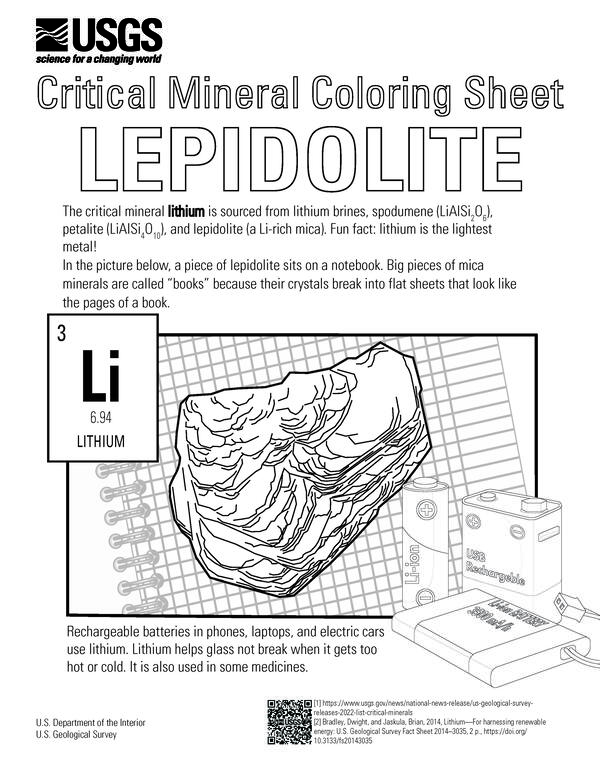
USGS MRP Coloring Page Lepidolite
Critical Minerals Coloring Sheet: lepidolite
The critical mineral lithium is sourced from lithium brines, spodumene (LiAlSi2O6), petalite (LiAlSi4O10), and lepidolite (a Li-rich mica). Fun fact: lithium is the lightest metal!
Critical Minerals Coloring Sheet: lepidolite
The critical mineral lithium is sourced from lithium brines, spodumene (LiAlSi2O6), petalite (LiAlSi4O10), and lepidolite (a Li-rich mica). Fun fact: lithium is the lightest metal!
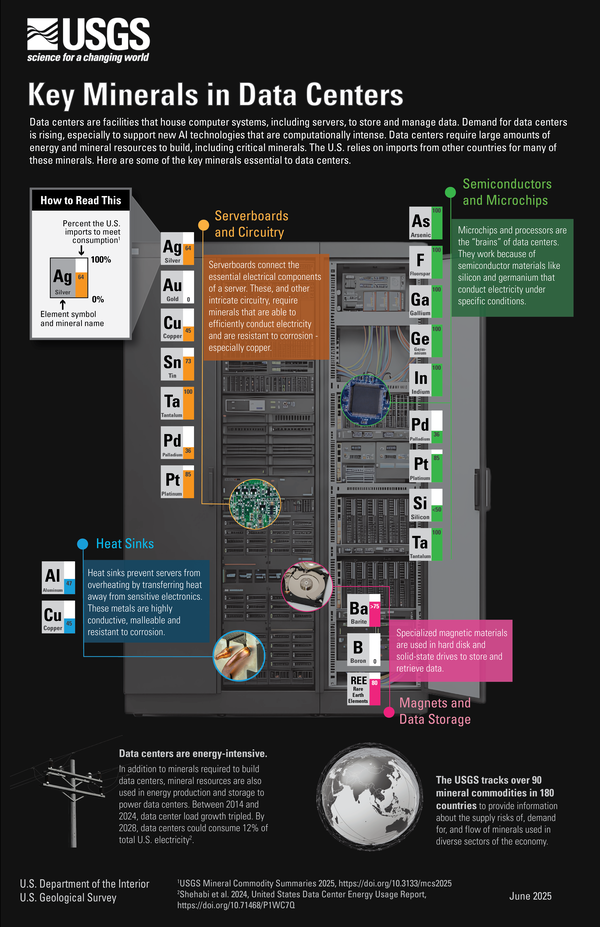
Key Minerals in Data Centers Infographic
Key Minerals in Data Centers
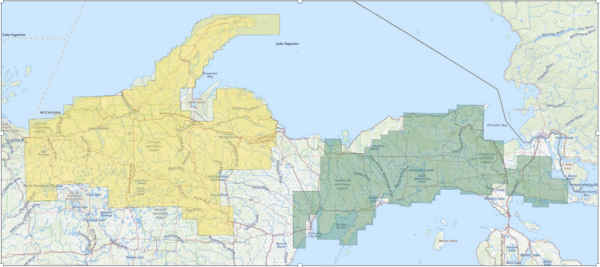
UPMI-WS LLFA.png
Map of the Upper Peninsula of Michigan and nearby areas of Northern Wisconsin, with areas of overflights shaded in yellow (Wisconsin) and green (Michigan).
Map of the Upper Peninsula of Michigan and nearby areas of Northern Wisconsin, with areas of overflights shaded in yellow (Wisconsin) and green (Michigan).

Minerals with Net Import Reliance on China
Mineral Commodities with Net Import Reliance on China
USGS collects the Nation’s data on the global production, supply, demand and trade of minerals to inform strategic policy, trade and land-use decisions.
Mineral Commodities with Net Import Reliance on China
USGS collects the Nation’s data on the global production, supply, demand and trade of minerals to inform strategic policy, trade and land-use decisions.

Solid Gallium Metal
Gallium is used in gallium arsenide and gallium nitride compound semiconductors. There is additional production capacity for gallium outside China with the potential to produce gallium in Germany, Kazakhstan and South Korea in response to China’s gallium export ban to the U.S.
Gallium is used in gallium arsenide and gallium nitride compound semiconductors. There is additional production capacity for gallium outside China with the potential to produce gallium in Germany, Kazakhstan and South Korea in response to China’s gallium export ban to the U.S.