U.S. flag

An official website of the United States government

Multimedia

The following photos and video presentations highlight the work of the USGS scientists in the Great Lakes Region. 

Images

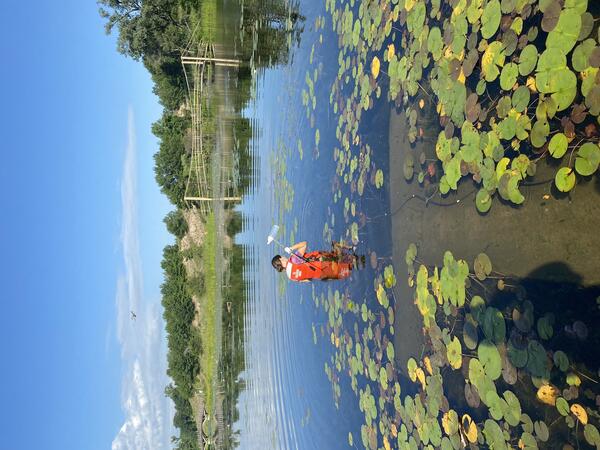
A woman stands in the water amongst lily pads holding a sampling bottle.
Collection of a discrete water-quality sample at the Grand Calumet Lagoon

On July 13, 2022, USGS scientists collected water quality samples at 3 sites in support of a study on eutrophication in the Grand Calumet River Area of Concern. The site pictured here is 413704087153501 Grand Calumet Lagoon at Marquette Park at Gary, IN, which was the background site for the study. Samples were collected for nutrients and isotopes.
On July 13, 2022, USGS scientists collected water quality samples at 3 sites in support of a study on eutrophication in the Grand Calumet River Area of Concern. The site pictured here is 413704087153501 Grand Calumet Lagoon at Marquette Park at Gary, IN, which was the background site for the study. Samples were collected for nutrients and isotopes.

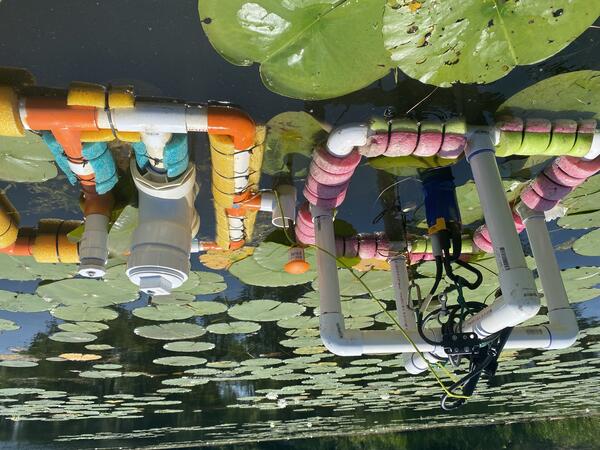
Two water quality floats in a pool with lily pads
Two Water Quality Floats Holding Sondes

Two floats constructed of polyvinyl chloride (PVC) and polyethylene foam (pool noodles) float in a pool among lily pads. The floats each hold water quality sondes that collect data continuously. On the float on the left you can see the sonde hanging from the cross pieces, on the right-hand float the sondes are encased in the capped PVC tubes. 

Two floats constructed of polyvinyl chloride (PVC) and polyethylene foam (pool noodles) float in a pool among lily pads. The floats each hold water quality sondes that collect data continuously. On the float on the left you can see the sonde hanging from the cross pieces, on the right-hand float the sondes are encased in the capped PVC tubes. 

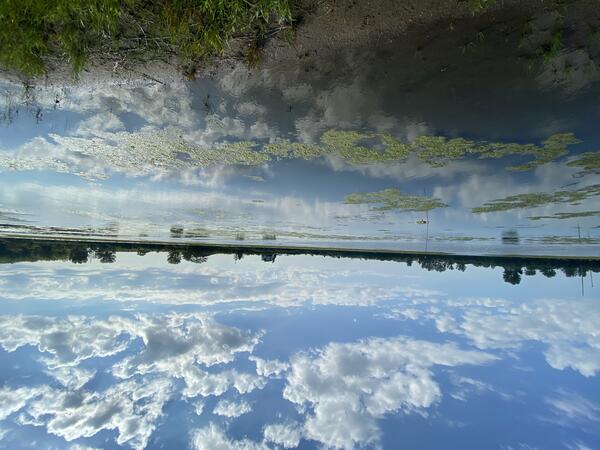
The blue sky is reflected in the water, disrupted by large green algal mats.
Algal Mats Floating on the Surface of the Grand Calumet River Near Kennedy Avenue, Hammond, IN.

Algal mats are floating on the surface of the water. This site is in the Grand Calumet River Area of Concern and has been dredged and capped to try to remediate pollution from historic industrial activity.

Grass carp larvae
Grass carp larvae
Grass carp larvae
Grass carp larvae

These images show grass carp larvae from the Maumee River. Characteristics of larval grass carp include overall length (left), skeletal muscle development (center) and presence of an eye spot that lacks pigmentation (right; pigment starting to develop on lower eye).

These images show grass carp larvae from the Maumee River. Characteristics of larval grass carp include overall length (left), skeletal muscle development (center) and presence of an eye spot that lacks pigmentation (right; pigment starting to develop on lower eye).

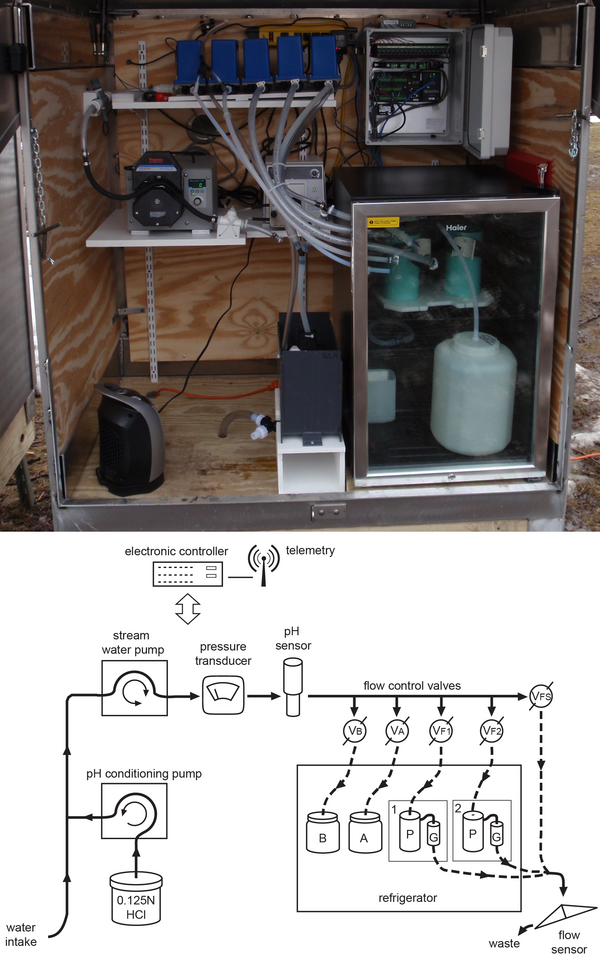
A custom automated pathogen sampler and schematic illustration.

A photograph of U.S. Geological Survey (USGS) custom automated pathogen sampler (top) and schematic illustrating the remote-unattended-automated pathogen sampler (bottom). Sample collection proceeds over the course of a runoff-event or low-flow period for up to a maximum of 5 days before a site visit by personnel is needed to collect the samples.

A photograph of U.S. Geological Survey (USGS) custom automated pathogen sampler (top) and schematic illustrating the remote-unattended-automated pathogen sampler (bottom). Sample collection proceeds over the course of a runoff-event or low-flow period for up to a maximum of 5 days before a site visit by personnel is needed to collect the samples.

Videos

Monitoring Stormwater and Green Infrastructure (Gary City Hall, Ind.)

This time-lapse video shows the construction of the new Gary City Hall parking lot and rain garden in Gary, Indiana. The City of Gary is utilizing green infrastructure in their redevelopment projects in the hopes of reducing the amount stormwater runoff that enters their storm-sewer system and, eventually, Lake Michigan.

This time-lapse video shows the construction of the new Gary City Hall parking lot and rain garden in Gary, Indiana. The City of Gary is utilizing green infrastructure in their redevelopment projects in the hopes of reducing the amount stormwater runoff that enters their storm-sewer system and, eventually, Lake Michigan.

Edge-of-Field Monitoring Using Depth-Integrated Sample Arm (DISA)

During edge-of-field monitoring of an agricultural field runoff event, a depth-integrated sample arm (DISA) is used to take a water sample at the same time a traditional water sample is taken from an intake located at the bottom of the H-flume exit, where the water is assumed to be completely mixed.

During edge-of-field monitoring of an agricultural field runoff event, a depth-integrated sample arm (DISA) is used to take a water sample at the same time a traditional water sample is taken from an intake located at the bottom of the H-flume exit, where the water is assumed to be completely mixed.

Time-Lapse of Edge-of-Field Event Near Fort Wayne, IN

Time-lapse photo of a rainfall-induced runoff event at an edge-of-field surface site near Fort Wayne, Indiana, on May 10-11, 2016. Edge-of-field monitoring is used to assess the quantity and quality of agricultural runoff and evaluate the effectiveness of conservation practices that aim to reduce nutrient loss.

Time-lapse photo of a rainfall-induced runoff event at an edge-of-field surface site near Fort Wayne, Indiana, on May 10-11, 2016. Edge-of-field monitoring is used to assess the quantity and quality of agricultural runoff and evaluate the effectiveness of conservation practices that aim to reduce nutrient loss.

Was this page helpful?