



The vital flow: Understanding water’s essential role in thermoelectric power generation
USGS reports critical data on water usage in thermoelectric power plants
When you get home in the evening after a long day of work and flip on the lights, you might not think about the intricate systems behind the electricity that powers your home. But the reality is that it takes a lot of science to deliver the electricity you expect and rely on in your house.
Thermoelectric power plants, which rely heavily on water for their operations, are among the most critical producers of energy in the U.S. As we move to unleash America’s energy potential and independence, understanding the role water plays in thermoelectric power generation has never been more vital.
How does a thermoelectric power plant work?
Thermoelectric plants use water in two ways: (1) by heating water into steam, and (2) by using cooling water to condense the steam back into liquid water. Water is first heated in a boiler using a fuel source (such as coal, natural gas, or nuclear reactions) to produce high pressure steam. As the steam expands, it spins a turbine. The turbine is connected to a generator, which then creates electrical energy. The steam from turbines is then routed to condensers where cooling water condenses the steam back to liquid water to be used again in the boiler. This cooling process creates a significant demand for water.
USGS is the home for national water use data
Since 1950, Congress has asked the U.S. Geological Survey (USGS) to track and report water use as part of the agency’s role in delivering routine water information. Understanding how much water is used, where, and when is vital to meeting the Nation’s water demand. Recently, the USGS has focused on the development of new modeling approaches that allow for the reporting of water use information on the same scales across space and time. These innovative water use estimates are consistent, reproducible and created in an efficient and transparent way.
Learn more about Water Use
Access Water Use Data
Learn more about NWAA
USGS modeled estimates of water use are available for multiple categories. Monthly estimates of public supply and crop irrigation water use estimates are published for 2000 to 2020, and monthly estimates of thermoelectric power generation water use are also available for 2008 to 2020. These data were compiled in the 2025 National Water Availability Assessment (NWAA) and are available on the NWAA Data Companion. The NWAA is the first comprehensive assessment of water availability that examines water quantity, quality, and usage for both human and ecosystem requirements across the lower 48 states. The authors of the NWAA applied advanced modeling techniques to provide a detailed analysis of the balance between natural water supply and demand at granular levels from 2010 to 2020, shedding light on regions in the U.S. potentially facing imbalances between supply and usage. Learn more about other Key Findings from the NWAA Report in this interactive explainer from the USGS Vizlab.
Thermoelectric power generation: Large withdrawals, but also large returns
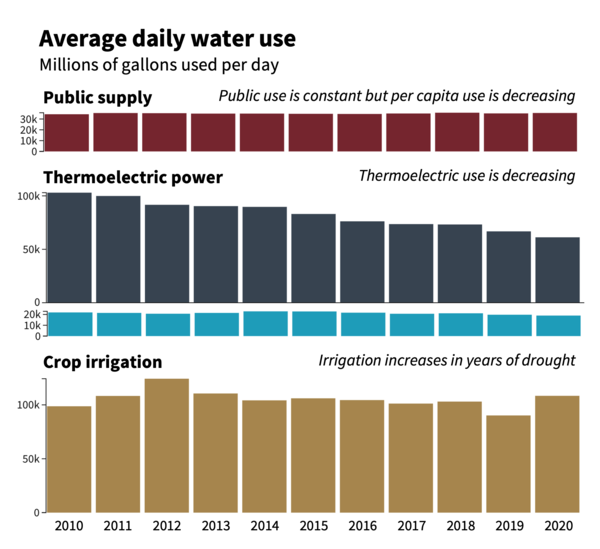
In the 2020 water year (October 1, 2019 through September 30, 2020), thermoelectric power generation, public supply, and crop irrigation accounted for about 90% (approximately 224,000 million gallons of water per day) of the freshwater withdrawn daily in the lower 48 states. Thermoelectric power made up 36% of that volume at about 82,000 million gallons of water a day.
While most of water used in thermoelectric plants in the U.S. is freshwater, some thermoelectric power plants also use saline water, which reduces the demand for freshwater. In addition to freshwater withdrawals, USGS found that approximately 21,000 million gallons of saline water are used per day in thermoelectric plants, calculated from mean values from water years 2009 to 2020. Saline water withdrawals are particularly relevant for facilities located along the Eastern coastline, where sources are readily available.
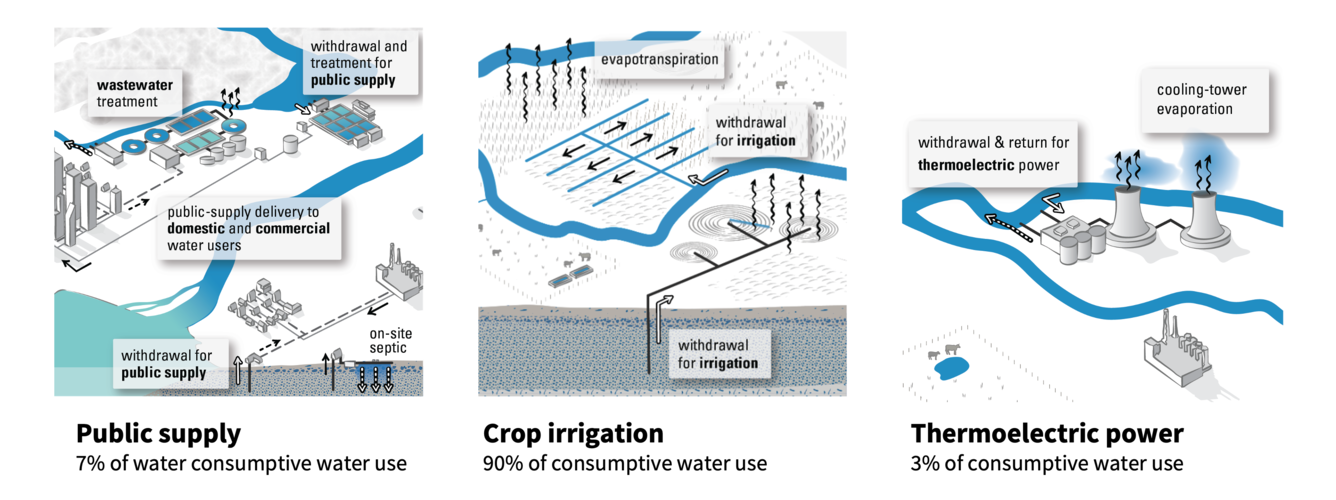
Water withdrawals that do not return to the original source are referred to as “consumptive use”. But not all the water used by humans is lost: Much of the withdrawn water returns to the local environment and becomes available for other uses. In fact, nearly all (96%) of the freshwater used in thermoelectric power generation is eventually returned, although the rate varies based on the type of cooling system employed by a given plant. Crop irrigation, on the other hand, has high consumptive use (90 %) because a lot of water used to irrigate farm fields is lost to evapotranspiration or crop uptake.
While most of water used in thermoelectric plants in the U.S. is freshwater, some thermoelectric power plants also use saline water, which reduces the demand for freshwater. USGS found that approximately 21,000 million gallons of saline water are used per day in thermoelectric plants, in addition to freshwater. Saline water withdrawals are particularly relevant for facilities located along the Eastern coastline, where sources are readily available.
Water withdrawals that do not return to the original source are referred to as “consumptive use”. But not all the water used by humans is lost: Much of the withdrawn water returns to the local environment and becomes available for other uses. In fact, nearly all (96%) of the freshwater used in thermoelectric power generation is eventually returned, although the rate varies based on the type of cooling system employed by a given plant. Crop irrigation, on the other hand, has high consumptive use (90 %) because a lot of water used to irrigate farm fields is lost to evapotranspiration or crop uptake.
Thermoelectric water use efficiency depends on cooling system type
Thermoelectric power plants typically use one of two primary cooling systems. The first is a once-through cooling system, characterized by withdrawing large amounts of water from nearby sources that flow through the plant one time and are then discharged back to a water source at a warmer temperature. Once-through cooling systems have a relatively low consumptive use rate—about 1% of what is withdrawn, as calculated on average from 2009-2020.
The second is a recirculating cooling system, which withdraws smaller amounts of water that are routed through the plant multiple times. However, the lower withdrawal rate comes with a trade-off: the consumptive use rates are higher compared to a once-through system, often exceeding 70% for recirculating cooling towers and 100% for recirculating cooling ponds.
Patterns in water use through space and time
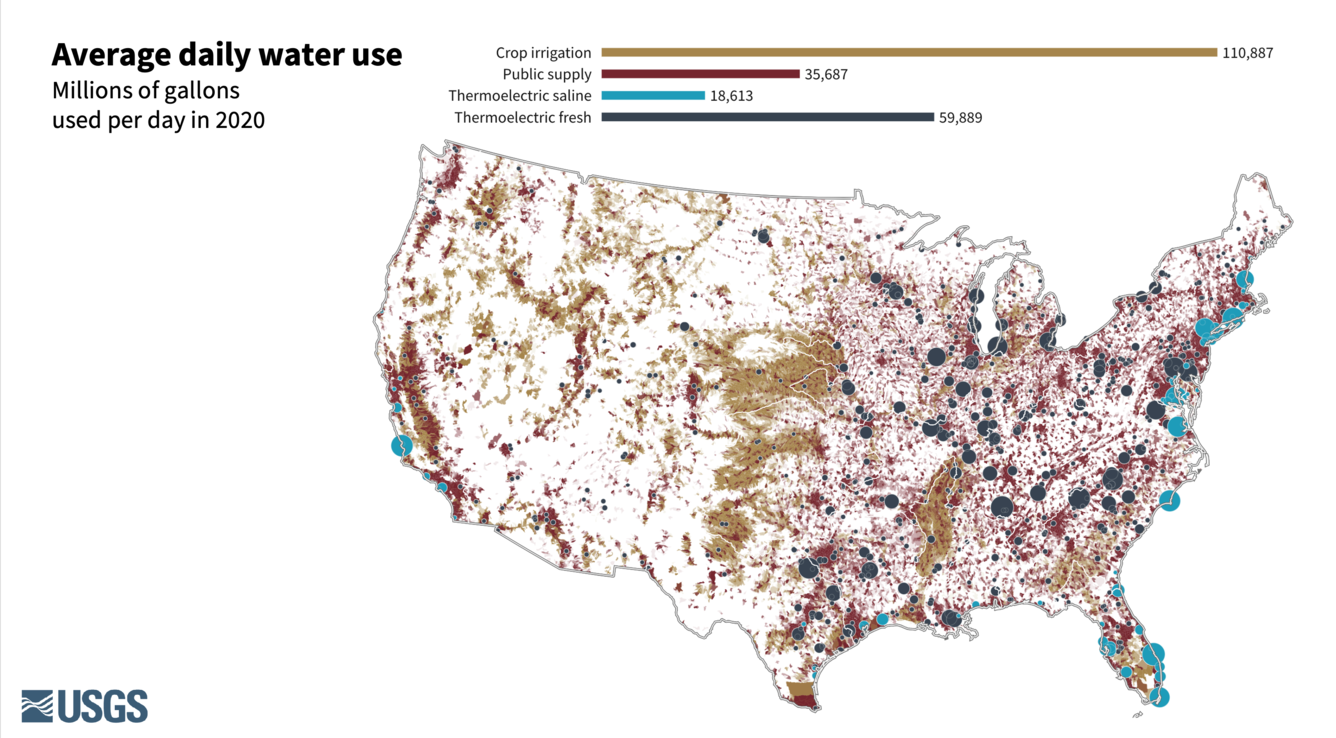
In the Eastern U.S., thermoelectric power plants are more likely to withdraw from surface water sources. In contrast, thermoelectric power plants in Western states often withdraw water from alternative sources such as groundwater, purchase water from public water utilities, and use reclaimed wastewater. Saline water sources for thermoelectric water use are located along the Eastern and Western seaboards, with a higher number of overall thermoelectric power plants using both saline and freshwater on the Eastern coast.
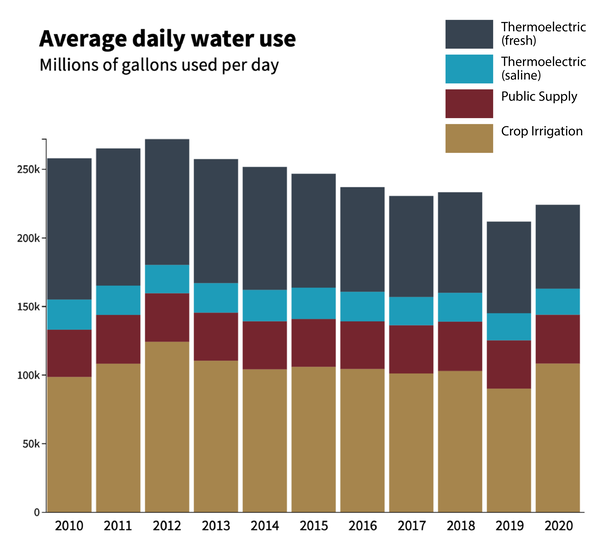
In addition to all of this, USGS data on thermoelectric water use from 2008 to 2020 reveal a noteworthy trend through time. Data show a 40% decline in water withdrawals for thermoelectric power generation, and a 25% decrease in consumptive use. The primary reason for the decline is the reduced use and retirement of coal-fired power plants. American energy production is moving away from traditional combustion steam plants (like coal-fired plants) that tend to rely on once-through cooling systems and moving toward more energy- and water-efficient power plants supplied by natural gas and cooled by recirculating systems. This shift in energy production water use was responsible for the overall decrease in water withdrawals observed in U.S. between 2010 and 2020.
There are many important demands on the finite water resources of the U.S. Water demands to support thermoelectric power generation need to be balanced with other water uses through effective resource management. The findings from the National Water Availability Assessment highlight the need for ongoing monitoring, modeling, and dialogue to ensure that, through data-driven management of water resources, thermoelectric power generation remains a reliable source of energy while safeguarding other important water uses. In doing so, we can create a more resilient future that prioritizes energy needs, safe drinking water, a stable food supply, and ecological health and functionality.
Read the full National Water Availability Assessment Report for more information.
Related

Thermoelectric Power Water Use

Accessing Water Use Data

Water Use in the United States
Thermoelectric Power Water Use

National Water Availability Assessments
National Water Availability Assessment: Key Findings

National Water Availability Assessment Reports

National Water Availability Assessment Data Companion
Related
Thermoelectric Power Water Use
Accessing Water Use Data
Water Use in the United States
Thermoelectric Power Water Use
National Water Availability Assessments
National Water Availability Assessment: Key Findings
National Water Availability Assessment Reports