
Measuring streamflow, Fontenelle Creek
Images
Images intro.
Filter Total Items: 709

Measuring streamflow, Fontenelle Creek

Measuring streamflow through augered holes, North Platte nr Northgate
Measuring streamflow through augered holes, North Platte nr NorthgateMeasuring streamflow through augered holes, North Platte nr Northgate
Measuring streamflow through augered holes, North Platte nr Northgate
Measuring streamflow through augered holes, North Platte nr NorthgateMeasuring streamflow through augered holes, North Platte nr Northgate

Chopping ice to create open channel to measure streamflow, Blacks Fk
Chopping ice to create open channel to measure streamflow, Blacks FkChopping ice to create open channel to measure streamflow, Blacks Fk
Chopping ice to create open channel to measure streamflow, Blacks Fk
Chopping ice to create open channel to measure streamflow, Blacks FkChopping ice to create open channel to measure streamflow, Blacks Fk

Auguring holes to measure streamflow, Blacks Fork Robertson
Auguring holes to measure streamflow, Blacks Fork RobertsonAuguring holes to measure streamflow, Blacks Fork Robertson
Auguring holes to measure streamflow, Blacks Fork Robertson
Auguring holes to measure streamflow, Blacks Fork RobertsonAuguring holes to measure streamflow, Blacks Fork Robertson

Measuring streamflow, Yellowstone River at Lake Outlet
Measuring streamflow, Yellowstone River at Lake OutletMeasuring streamflow, Yellowstone River at Lake Outlet
Measuring streamflow, Yellowstone River at Lake Outlet
Measuring streamflow, Yellowstone River at Lake OutletMeasuring streamflow, Yellowstone River at Lake Outlet

Blackrock Creek streamgage
Blackrock Creek streamgage

Snowmibiles needed to get to Blackrock Creek streamgage
Snowmibiles needed to get to Blackrock Creek streamgageSnowmibiles needed to get to Blackrock Creek streamgage
Snowmibiles needed to get to Blackrock Creek streamgage
Snowmibiles needed to get to Blackrock Creek streamgageSnowmibiles needed to get to Blackrock Creek streamgage

USGS WY-MT WSC Riverton Office
USGS WY-MT WSC Riverton Office

Time series of vertical displacements during April–October 2017 at four GPS stations on the north side of Yellowstone Lake
Time series of vertical displacements during April–October 2017 at four GPS stations on the north side of Yellowstone LakeTime series of vertical displacements during April–October 2017 at four GPS stations (LAK1, LAK2, LKWY, and SEDG) on the north side of Yellowstone Lake. Downward trends indicate subsidence and upward trends show uplift. Uplift “spikes” in late September are related to inclement weather and do not show true deformation. Error bars are one standard deviation.

Field crew setting up a magnetotelluric site in Yellowstone National Park
Field crew setting up a magnetotelluric site in Yellowstone National ParkField crew from Oregon State University and University of Wisconsin-Madison install a magnetotelluric site within Yellowstone National Park.
Field crew setting up a magnetotelluric site in Yellowstone National Park
Field crew setting up a magnetotelluric site in Yellowstone National ParkField crew from Oregon State University and University of Wisconsin-Madison install a magnetotelluric site within Yellowstone National Park.

Jackson Hole Airport groundwater study area map
Jackson Hole Airport groundwater study area map

Map showing volcanoes that formed at the leading edge of the Yellowstone hotspot in the past several million years
Map showing volcanoes that formed at the leading edge of the Yellowstone hotspot in the past several million yearsMap showing volcanoes that formed at the leading edge of the Yellowstone hotspot in the past several million years. (A) Map of northwest Wyoming, eastern Idaho, and southern Montana (modified from Brueseke et al., 2017, https://doi.org/10.1130/GES01553.1). Upper Wind River Basin (UWRB) is depicted by dashe

Grant Village boat dock, on the West Thumb of Yellowstone Lake, where a water-level sensor measures lake level
Grant Village boat dock, on the West Thumb of Yellowstone Lake, where a water-level sensor measures lake levelGrant Village boat dock, on the West Thumb of Yellowstone Lake, where a water-level sensor measures the level of the lake. Photo by David Mencin (EarthScope Consortium).

Head of an immature wetsalts tiger beetle at the entrance to the burrow it dug
Head of an immature wetsalts tiger beetle at the entrance to the burrow it dugThe head of an immature wetsalts tiger beetle at the entrance to the burrow it dug. Photo by Robert K. D. Peterson, 2017.
Head of an immature wetsalts tiger beetle at the entrance to the burrow it dug
Head of an immature wetsalts tiger beetle at the entrance to the burrow it dugThe head of an immature wetsalts tiger beetle at the entrance to the burrow it dug. Photo by Robert K. D. Peterson, 2017.

USGS WY-MT WSC Casper Office
USGS Casper Office

Measuring streamflow in Goose Creek, near Acme, station 06305700
Measuring streamflow in Goose Creek, near Acme, station 06305700Measuring streamflow in Goose Creek, near Acme, station 06305700
Measuring streamflow in Goose Creek, near Acme, station 06305700
Measuring streamflow in Goose Creek, near Acme, station 06305700Measuring streamflow in Goose Creek, near Acme, station 06305700

Measuring streamflow under ice, Pass Creek, nr Parkman, WY
Measuring streamflow under ice, Pass Creek, nr Parkman, WYMeasuring streamflow under ice, Pass Creek, near Parkman, WY, station 06289600
Measuring streamflow under ice, Pass Creek, nr Parkman, WY
Measuring streamflow under ice, Pass Creek, nr Parkman, WYMeasuring streamflow under ice, Pass Creek, near Parkman, WY, station 06289600

Cheyenne Wyoming office
Cheyenne Wyoming office

Reading stream stage at Bull Lake Creek above Bull Lake streamgage
Reading stream stage at Bull Lake Creek above Bull Lake streamgageThe wire weight is lowered to determine stage of Bull Lake Creek above Bull Lake
Reading stream stage at Bull Lake Creek above Bull Lake streamgage
Reading stream stage at Bull Lake Creek above Bull Lake streamgageThe wire weight is lowered to determine stage of Bull Lake Creek above Bull Lake

WorldView-2 satellite image showing thermal areas on the north side of Mallard Lake resurgent dome in Yellowstone National Park.
WorldView-2 satellite image showing thermal areas on the north side of Mallard Lake resurgent dome in Yellowstone National Park.WorldView-2 natural-color satellite image from December 9, 2017, showing thermal areas as snow-free zones on the north side of Mallard Lake resurgent dome in Yellowstone National Park.
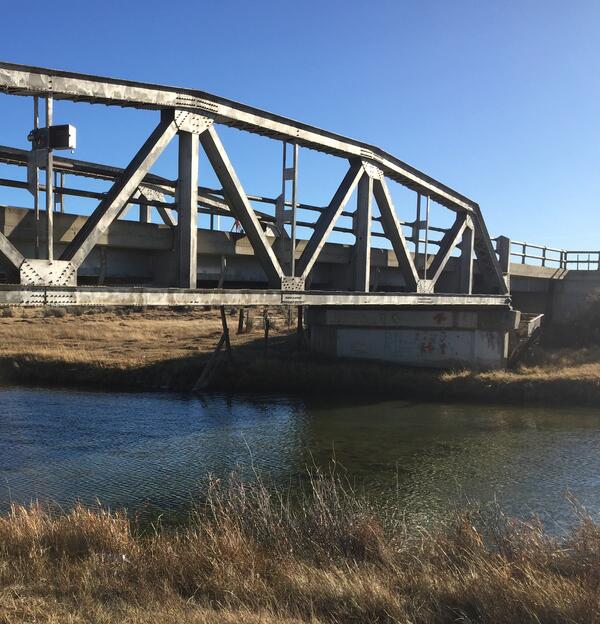
Wire weight mounted on bridge crossing Blacks Fork, streamgage 0921920
Wire weight mounted on bridge crossing Blacks Fork, streamgage 0921920Wire weight mounted on bridge crossing Blacks Fork, streamgage 09219200
Wire weight mounted on bridge crossing Blacks Fork, streamgage 0921920
Wire weight mounted on bridge crossing Blacks Fork, streamgage 0921920Wire weight mounted on bridge crossing Blacks Fork, streamgage 09219200