Virginia and West Virginia Monitoring Networks

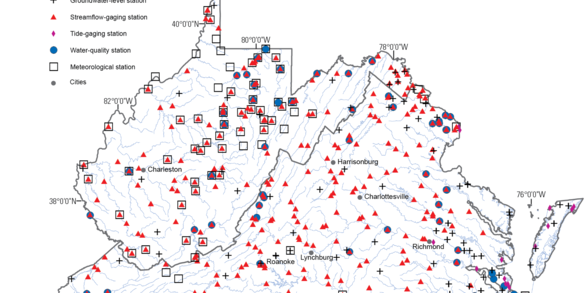
The Virginia and West Virginia Water Science Center maintains multiple networks of groundwater and surface water monitoring sites. Explore our monitoring networks and download surface water, groundwater, and water quality monitoring data for active sites using our monitoring network mapper.
About this Tool
The Virginia and West Virginia Groundwater Levels and Trends web application provides access to groundwater level data from continuous groundwater wells across Virginia and West Virginia. Recent water-level measurements for all wells considered are compared to long-term monthly statistics using functions in the HASP R Package. Wells are classified and visualized according to water-level conditions relative to long-term monthly statistics.
For each well, additional information and links to the real time data in Water Data for the Nation is provided on detailed site pages accessible through the pop-up information in the map and in the Network Well List at the bottom of the page. The information on this page updates daily, though some continuous measurements can be as frequent as every five minutes.
Unprocessed groundwater level data are always available on Water Data For the Nation. This website is the best place to get the most recent, uninterpreted data and will include provisional data not shown in this application. It contains water resources data collected from approximately 1.9 million sites in all 50 states, the District of Columbia, Puerto Rico, the Virgin Islands, Guam, American Samoa and the Commonwealth of the Northern Mariana Islands.
Visit usgs.gov/gwsip to learn more about groundwater monitoring efforts by the USGS and partners.
Related Content
Explore U.S. Geological Survey science related to groundwater and drought monitoring, groundwater quality, and water use.
PFAS in West Virginia's Groundwater and Surface Water
Land Subsidence on the Virginia Coastal Plain
Virginia Eastern Shore Groundwater Resources
Explore other U.S. Geological Survey web tools related to groundwater and drought monitoring, groundwater quality, and water use.
Interactive Map: Estimating Drought Streamflow Probabilities for Virginia Streams
Maximum likelihood logistic regression is used to estimate drought probabilities for selected Virginia rivers and streams 5 to 11 months in advance. Hydrologic drought streamflow probabilities for summer months are provided as functions of streamflows during the previous winter months. This application allows the display and query of these drought streamflow probabilities for Virginia streams.
Interactive Map: Virginia Water-Monitoring Sites
The Virginia Water-Monitoring-Sites Mapper is an interactive map of Virginia water monitoring-site locations from the USGS National Water Information System. It provides access to surface water, groundwater, and water quality monitoring data for active sites.
Interactive Map: West Virginia Water-Monitoring Sites
The West Virginia Water-Monitoring-Sites Mapper is an interactive map of West Virginia water monitoring-site locations from the USGS National Water Information System. It provides access to surface water, groundwater, and water quality monitoring data for active sites.
HASP
Related Content
- Science
Explore U.S. Geological Survey science related to groundwater and drought monitoring, groundwater quality, and water use.
PFAS in West Virginia's Groundwater and Surface Water
In 2019, the West Virginia legislature recognized the contamination risk to public source-water supplies posed by per- and polyfluoroalkyl substances (PFAS) and passed a resolution that required a statewide PFAS study. The purpose of this resulting study was to understand the occurrence and distribution of PFAS contamination throughout the state’s rivers, lakes, and groundwater aquifers. This...Land Subsidence on the Virginia Coastal Plain
Land subsidence is a loss of ground elevation, often experienced as the ground slowly sinking over the course of years. In eastern Virginia, high rates of groundwater use is a major factor in the land subsidence affecting the area. The Virginia-West Virginia Water Science Center, with the help of our partners, has been monitoring land subsidence in the Virginia Coastal Plain since 1979 using a...Virginia Eastern Shore Groundwater Resources
Informed management of groundwater resources for the Eastern Shore of Virginia depends on the availability of detailed and up-to-date scientific information. The USGS and the Virginia Department of Environmental Quality are conducting a long-term cooperative study to enhance the understanding of groundwater resources in the sole-source aquifer system beneath Accomack and Northampton counties... - Web Tools
Explore other U.S. Geological Survey web tools related to groundwater and drought monitoring, groundwater quality, and water use.
Interactive Map: Estimating Drought Streamflow Probabilities for Virginia Streams
Maximum likelihood logistic regression is used to estimate drought probabilities for selected Virginia rivers and streams 5 to 11 months in advance. Hydrologic drought streamflow probabilities for summer months are provided as functions of streamflows during the previous winter months. This application allows the display and query of these drought streamflow probabilities for Virginia streams.
Interactive Map: Virginia Water-Monitoring Sites
The Virginia Water-Monitoring-Sites Mapper is an interactive map of Virginia water monitoring-site locations from the USGS National Water Information System. It provides access to surface water, groundwater, and water quality monitoring data for active sites.
Interactive Map: West Virginia Water-Monitoring Sites
The West Virginia Water-Monitoring-Sites Mapper is an interactive map of West Virginia water monitoring-site locations from the USGS National Water Information System. It provides access to surface water, groundwater, and water quality monitoring data for active sites.
- Software
HASP
The Hydrologic Analysis Package (HASP) can retrieve groundwater level and groundwater quality data, aggregate these data, plot them, and generate basic statistics. One of the benefits of HASP is its ability to aggregate two time-series of data into one record and generate statistics and graphics on hat record. By merging two data sets together, users can view and manipulate a much longer record o