Temporary webcam deployed on the boardwalk in Biscuit Basin, Yellowstone National Park. The pan/tilt/zoom camera provides a static view every 15 minutes and records video on site for later download as needed. Black Diamond Pool, site of a hydrothermal explosion on July 23, 2024, is in the background. This work was completed under Yellowstone Nation
Images
Images of Yellowstone.
Temporary webcam deployed on the boardwalk in Biscuit Basin, Yellowstone National Park. The pan/tilt/zoom camera provides a static view every 15 minutes and records video on site for later download as needed. Black Diamond Pool, site of a hydrothermal explosion on July 23, 2024, is in the background. This work was completed under Yellowstone Nation
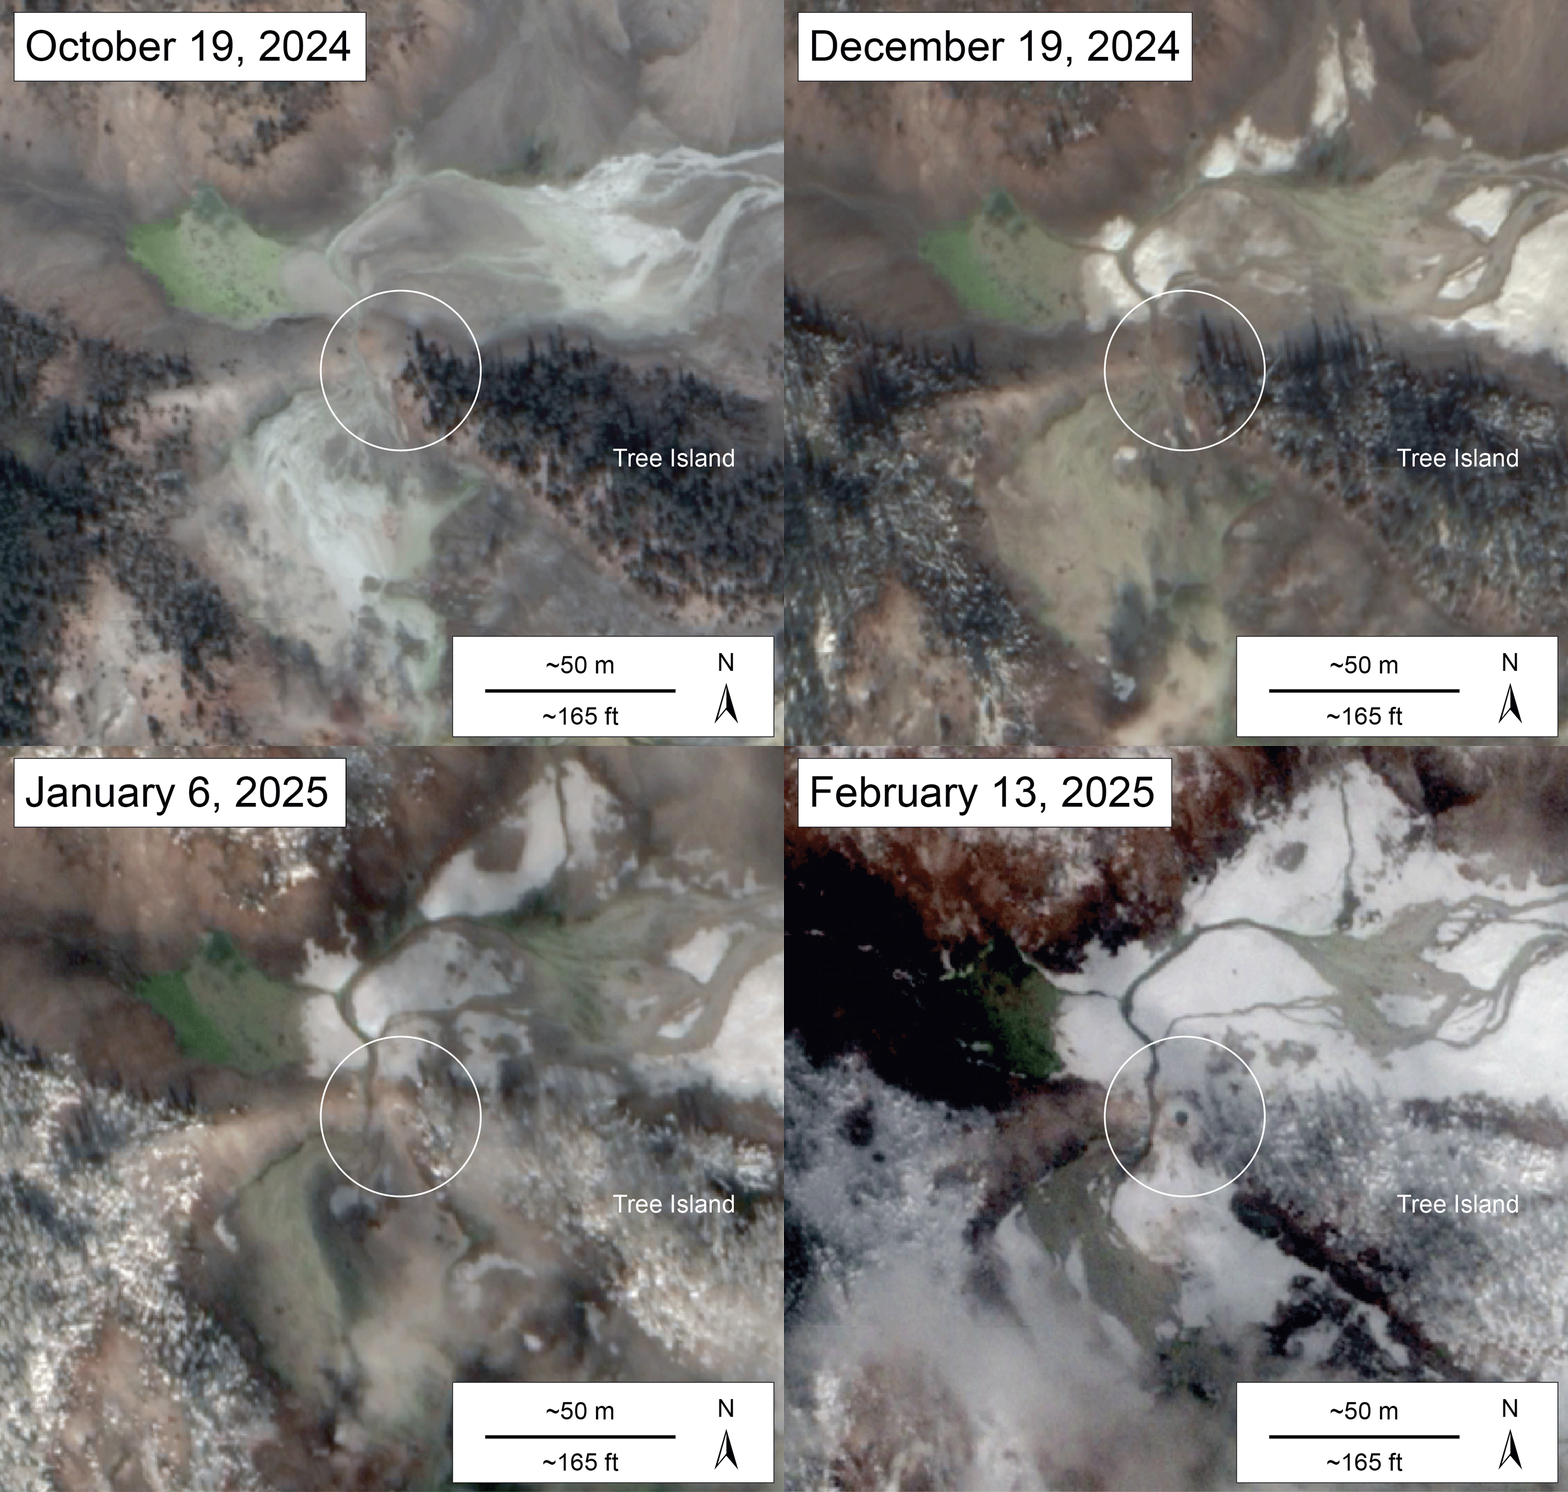
New hydrothermal feature near "Tree Island" in Norris Geyser Basin, Yellowstone National Park
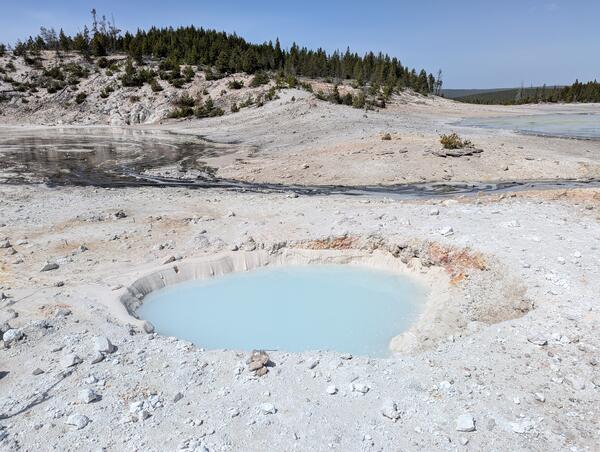
New hydrothermal feature near "Tree Island" in Norris Geyser Basin, Yellowstone National ParkView looking northwest at a new thermal pool in the Porcelain Basin area of Norris Geyser Basin, Yellowstone National Park, that probably formed in a series of mildly explosive events between late December 2024 and early February 2025. The rocks and white material (silica mud) surrounding the pool were probably ejected as the feature formed. The pool is
New hydrothermal feature near "Tree Island" in Norris Geyser Basin, Yellowstone National Park
New hydrothermal feature near "Tree Island" in Norris Geyser Basin, Yellowstone National ParkView looking northwest at a new thermal pool in the Porcelain Basin area of Norris Geyser Basin, Yellowstone National Park, that probably formed in a series of mildly explosive events between late December 2024 and early February 2025. The rocks and white material (silica mud) surrounding the pool were probably ejected as the feature formed. The pool is
Digging through the snow to install a semi-permanent GPS site in Yellowstone National Park
Digging through the snow to install a semi-permanent GPS site in Yellowstone National ParkYellowstone National Park Geology Program team members Samantha Hilburn (left) and Margery Price (right), both Physical Science Technicians, pose with a snow pit dug near Lewis Canyon for installation of a semi-permanent GPS site, installed in collaboration with USGS scientists. USGS photo by Dan Dzurisin, May 2025.
Digging through the snow to install a semi-permanent GPS site in Yellowstone National Park
Digging through the snow to install a semi-permanent GPS site in Yellowstone National ParkYellowstone National Park Geology Program team members Samantha Hilburn (left) and Margery Price (right), both Physical Science Technicians, pose with a snow pit dug near Lewis Canyon for installation of a semi-permanent GPS site, installed in collaboration with USGS scientists. USGS photo by Dan Dzurisin, May 2025.
Map of Yellowstone thermal areas with insets showing high-resolution satellite views of selected regions
Map of Yellowstone thermal areas with insets showing high-resolution satellite views of selected regionsMap of Yellowstone’s thermal areas. Inset commercial satellite images highlight thermal areas that are mentioned below: Sulphur Hills (©2022, Maxar, USG), Turbid Lake (©2022, Maxar, USG), and Lower Geyser Basin (©2015, Maxar, USG). This work utilized data made available through the NASA Commercial SmallSat Data Acquisition Program. We acknowledge th
Map of Yellowstone thermal areas with insets showing high-resolution satellite views of selected regions
Map of Yellowstone thermal areas with insets showing high-resolution satellite views of selected regionsMap of Yellowstone’s thermal areas. Inset commercial satellite images highlight thermal areas that are mentioned below: Sulphur Hills (©2022, Maxar, USG), Turbid Lake (©2022, Maxar, USG), and Lower Geyser Basin (©2015, Maxar, USG). This work utilized data made available through the NASA Commercial SmallSat Data Acquisition Program. We acknowledge th
Flume in an outflow channel of Old Faithful Geyser measuring the volume of water erupted
Flume in an outflow channel of Old Faithful Geyser measuring the volume of water eruptedPhoto of the flume in an outflow channel that was used for measuring the volume of water erupted from Old Faithful Geyser. Sandbags were placed to channel the water into the flume and prevent flow under and around it. The study was conducted under research permit YELL-SCI- 08342.
Flume in an outflow channel of Old Faithful Geyser measuring the volume of water erupted
Flume in an outflow channel of Old Faithful Geyser measuring the volume of water eruptedPhoto of the flume in an outflow channel that was used for measuring the volume of water erupted from Old Faithful Geyser. Sandbags were placed to channel the water into the flume and prevent flow under and around it. The study was conducted under research permit YELL-SCI- 08342.
Seismic reflections from the top of the magma reservoir beneath Yellowstone Caldera
Seismic reflections from the top of the magma reservoir beneath Yellowstone CalderaSeismic reflection data showing the top of the magma reservoir beneath Yellowstone Caldera along a cross section that runs from Canyon Village in the northwest (X) to near Lake Butte in the southeast (X`). The top panel shows seismic P-wave (compressional wave) reflectivity, with evidence for the sharp reservoir top labeled.
Seismic reflections from the top of the magma reservoir beneath Yellowstone Caldera
Seismic reflections from the top of the magma reservoir beneath Yellowstone CalderaSeismic reflection data showing the top of the magma reservoir beneath Yellowstone Caldera along a cross section that runs from Canyon Village in the northwest (X) to near Lake Butte in the southeast (X`). The top panel shows seismic P-wave (compressional wave) reflectivity, with evidence for the sharp reservoir top labeled.
Melt embayments and diffusion profiles to determine magma ascent rate
Melt embayments and diffusion profiles to determine magma ascent rateQuartz crystals (A) often contain melt embayments (tubular melt-filled pockets burrowed into the side of volcanic crystals) (B), which preserve volatiles (water, carbon dioxide, and sulfur) that have different concentrations in different parts of the embayment (C).
Melt embayments and diffusion profiles to determine magma ascent rate
Melt embayments and diffusion profiles to determine magma ascent rateQuartz crystals (A) often contain melt embayments (tubular melt-filled pockets burrowed into the side of volcanic crystals) (B), which preserve volatiles (water, carbon dioxide, and sulfur) that have different concentrations in different parts of the embayment (C).
Map of Roadside Springs thermal area, Yellowstone National Park
Map of Roadside Springs thermal area, Yellowstone National ParkMap showing the Roadside Springs thermal area, located just north of Nymph Lake along the Norris-Mammoth highway. Hydrothermal ground is shaded purple. New hydrothermal features formed in 2003 on the north side of Nymph Lake, and also in 2024 a bit further north from the lake. Figure by Jefferson Hungerford, Yellowstone National Park.
Map of Roadside Springs thermal area, Yellowstone National Park
Map of Roadside Springs thermal area, Yellowstone National ParkMap showing the Roadside Springs thermal area, located just north of Nymph Lake along the Norris-Mammoth highway. Hydrothermal ground is shaded purple. New hydrothermal features formed in 2003 on the north side of Nymph Lake, and also in 2024 a bit further north from the lake. Figure by Jefferson Hungerford, Yellowstone National Park.
Aerial view of Roadside Springs thermal area, Yellowstone National Park
Aerial view of Roadside Springs thermal area, Yellowstone National ParkAerial view looking to the west at the Roadside Springs hydrothermal area and Nymph Lake showing the locations of thermal features that formed in 2003 and 2024. Yellow line marks the Mammoth-Norris highway. Figure by Jefferson Hungerford, Yellowstone National Park.
Aerial view of Roadside Springs thermal area, Yellowstone National Park
Aerial view of Roadside Springs thermal area, Yellowstone National ParkAerial view looking to the west at the Roadside Springs hydrothermal area and Nymph Lake showing the locations of thermal features that formed in 2003 and 2024. Yellow line marks the Mammoth-Norris highway. Figure by Jefferson Hungerford, Yellowstone National Park.
Range of speeds for several animals, athletes, and magmas from various volcanic eruptions.
Range of speeds for several animals, athletes, and magmas from various volcanic eruptions.Range of speeds for several animals, athletes, and magmas from various volcanic eruptions. Eruptions shown include the 25,400-year-old Oruanui eruption of Taupo (New Zealand), the 2.08-million-year-old Huckleberry Ridge Tuff of Yellowstone (USA), and the 767,000-year-old Bishop Tuff of Long Valley (USA). Magma ascent rates determined by Myers et al. (2018).
Range of speeds for several animals, athletes, and magmas from various volcanic eruptions.
Range of speeds for several animals, athletes, and magmas from various volcanic eruptions.Range of speeds for several animals, athletes, and magmas from various volcanic eruptions. Eruptions shown include the 25,400-year-old Oruanui eruption of Taupo (New Zealand), the 2.08-million-year-old Huckleberry Ridge Tuff of Yellowstone (USA), and the 767,000-year-old Bishop Tuff of Long Valley (USA). Magma ascent rates determined by Myers et al. (2018).
Map of the Northwestern United States showing major volcanic features associated with the Yellowstone mantle plume
Map of the Northwestern United States showing major volcanic features associated with the Yellowstone mantle plumeMap of the Northwestern United States showing major volcanic features associated with the mantle plume currently underneath Yellowstone caldera. Colors indicate general basaltic (blues) versus rhyolitic (reds) compositions, with shades indicating age (darker shades are older). Rough outlines of calderas that formed due to the Yellowstone hotspot are give
Map of the Northwestern United States showing major volcanic features associated with the Yellowstone mantle plume
Map of the Northwestern United States showing major volcanic features associated with the Yellowstone mantle plumeMap of the Northwestern United States showing major volcanic features associated with the mantle plume currently underneath Yellowstone caldera. Colors indicate general basaltic (blues) versus rhyolitic (reds) compositions, with shades indicating age (darker shades are older). Rough outlines of calderas that formed due to the Yellowstone hotspot are give
Geologic domains of the Greater Yellowstone Ecosystem
Geologic domains of the Greater Yellowstone EcosystemMap of the geologic domains of the Greater Yellowstone Ecosystem (GYE). Boundaries are approximate.
Geologic domains of the Greater Yellowstone Ecosystem
Geologic domains of the Greater Yellowstone EcosystemMap of the geologic domains of the Greater Yellowstone Ecosystem (GYE). Boundaries are approximate.
Schematic showing magma storage beneath Yellowstone caldera based on magnetotelluric data
Schematic showing magma storage beneath Yellowstone caldera based on magnetotelluric dataSchematic showing magma storage beneath Yellowstone caldera. Nested calderas resulting from the Huckleberry Ridge Tuff, Mesa Falls Tuff, and Lava Creek Tuff caldera forming eruptions are shown as solid black, green, and orange lines, respectively.
Schematic showing magma storage beneath Yellowstone caldera based on magnetotelluric data
Schematic showing magma storage beneath Yellowstone caldera based on magnetotelluric dataSchematic showing magma storage beneath Yellowstone caldera. Nested calderas resulting from the Huckleberry Ridge Tuff, Mesa Falls Tuff, and Lava Creek Tuff caldera forming eruptions are shown as solid black, green, and orange lines, respectively.
Map of earthquakes in the Yellowstone National Park region in 2024
Map of earthquakes in the Yellowstone National Park region in 2024Map of seismicity (red circles) in the Yellowstone region during 2024. Gray lines are roads, black dashed line shows the caldera boundary, Yellowstone National Park is outlined by black dot-dashed line, and gray dashed lines denote state boundaries.
Map of earthquakes in the Yellowstone National Park region in 2024
Map of earthquakes in the Yellowstone National Park region in 2024Map of seismicity (red circles) in the Yellowstone region during 2024. Gray lines are roads, black dashed line shows the caldera boundary, Yellowstone National Park is outlined by black dot-dashed line, and gray dashed lines denote state boundaries.
Comparison of steep subduction and flat-slab subduction
Comparison of steep subduction and flat-slab subductionComparison of steep subduction (like that occurring today beneath the Pacific Northwest of the United States) and flat-slab subduction (which led to the formation of the Rocky Mountains a few tens of millions of years ago). Black arrows indicate the relative direction of movement of the oceanic plate.
Comparison of steep subduction and flat-slab subduction
Comparison of steep subduction and flat-slab subductionComparison of steep subduction (like that occurring today beneath the Pacific Northwest of the United States) and flat-slab subduction (which led to the formation of the Rocky Mountains a few tens of millions of years ago). Black arrows indicate the relative direction of movement of the oceanic plate.
Organizational chart for the Yellowstone Volcano Observatory in the event of a response to a geological hazard
Organizational chart for the Yellowstone Volcano Observatory in the event of a response to a geological hazardOrganization chart giving the structure of a response by the Yellowstone Volcano Observatory to a significant episode of unrest or eruption at the Yellowstone volcanic system. The strategy is scalable (elements are activated as they are needed and deactivated when they are no longer needed) and can be adapted to meet the needs of the event response.
Organizational chart for the Yellowstone Volcano Observatory in the event of a response to a geological hazard
Organizational chart for the Yellowstone Volcano Observatory in the event of a response to a geological hazardOrganization chart giving the structure of a response by the Yellowstone Volcano Observatory to a significant episode of unrest or eruption at the Yellowstone volcanic system. The strategy is scalable (elements are activated as they are needed and deactivated when they are no longer needed) and can be adapted to meet the needs of the event response.
Photo and cartoon of 1959 Hebgen Lake earthquake deposit in Henrys Lake (ID) sediment core, along with Cesium-137 levels
Photo and cartoon of 1959 Hebgen Lake earthquake deposit in Henrys Lake (ID) sediment core, along with Cesium-137 levelsPhoto and cartoon of 1959 Hebgen Lake earthquake deposit in sediment core from Henrys Lake, Idaho, with references to Cesium-137 activity (or concentration). Changes in Cesium-137 are related to atmospheric nuclear tests and provide a means of dating the deposit; those measurements are plotted on the right with depth (in cm) of the core.
Photo and cartoon of 1959 Hebgen Lake earthquake deposit in Henrys Lake (ID) sediment core, along with Cesium-137 levels
Photo and cartoon of 1959 Hebgen Lake earthquake deposit in Henrys Lake (ID) sediment core, along with Cesium-137 levelsPhoto and cartoon of 1959 Hebgen Lake earthquake deposit in sediment core from Henrys Lake, Idaho, with references to Cesium-137 activity (or concentration). Changes in Cesium-137 are related to atmospheric nuclear tests and provide a means of dating the deposit; those measurements are plotted on the right with depth (in cm) of the core.
Map of thermal areas in Yellowstone National Park (2024)
Map of thermal areas in Yellowstone National Park (2024)Map of thermal areas from ground-based mapping and remote-sensing methods compiled by Vaughn et al., 2024 (https://www.sciencebase.gov/catalog/item/661d5eb7d34e7eb9eb7e3a41).
Map of thermal areas in Yellowstone National Park (2024)
Map of thermal areas in Yellowstone National Park (2024)Map of thermal areas from ground-based mapping and remote-sensing methods compiled by Vaughn et al., 2024 (https://www.sciencebase.gov/catalog/item/661d5eb7d34e7eb9eb7e3a41).
Photoscans and computed tomography of sediment cores from Henrys Lake, Idaho
Photoscans and computed tomography of sediment cores from Henrys Lake, IdahoTransect of sediment cores from Henrys Lake, Idaho. (a) High‐resolution photoscans and computed tomography (CT) of each core correspond to the location tie line. White line on CT represents gamma ray attenuation bulk density (g/cc). Mapped facies are right of each correspondent core. Shades of gray represent background sedimentation and the event deposit by orange.
Photoscans and computed tomography of sediment cores from Henrys Lake, Idaho
Photoscans and computed tomography of sediment cores from Henrys Lake, IdahoTransect of sediment cores from Henrys Lake, Idaho. (a) High‐resolution photoscans and computed tomography (CT) of each core correspond to the location tie line. White line on CT represents gamma ray attenuation bulk density (g/cc). Mapped facies are right of each correspondent core. Shades of gray represent background sedimentation and the event deposit by orange.
Modern vegetation on different geological substrates in Yellowstone
Modern vegetation on different geological substrates in YellowstoneModern vegetation on different geological substrates in Yellowstone. Left: steppe/grassland on glacial clay found in places like Lamar and Hayden Valleys. Center: Mixed conifer forest in the Absaroka andesite volcanic field in the eastern part of Yellowstone National Park. Right: Lodgepole pine forest on Central Plateau rhyolite (hydrothermal grass
Modern vegetation on different geological substrates in Yellowstone
Modern vegetation on different geological substrates in YellowstoneModern vegetation on different geological substrates in Yellowstone. Left: steppe/grassland on glacial clay found in places like Lamar and Hayden Valleys. Center: Mixed conifer forest in the Absaroka andesite volcanic field in the eastern part of Yellowstone National Park. Right: Lodgepole pine forest on Central Plateau rhyolite (hydrothermal grass
Vegetation history based on pollen records from three small lakes on different geological substrates in Yellowstone National Park
Vegetation history based on pollen records from three small lakes on different geological substrates in Yellowstone National ParkVegetation history based on pollen records from three small lakes on different geological substrates in Yellowstone National Park. Blue is open vegetation, light green is parkland, dark green is forest. Top plot is from Slough Creek Pond, in a present grassland area dominated by glacial and lake sediment in the northeast part of Yellowstone Nationa
Vegetation history based on pollen records from three small lakes on different geological substrates in Yellowstone National Park
Vegetation history based on pollen records from three small lakes on different geological substrates in Yellowstone National ParkVegetation history based on pollen records from three small lakes on different geological substrates in Yellowstone National Park. Blue is open vegetation, light green is parkland, dark green is forest. Top plot is from Slough Creek Pond, in a present grassland area dominated by glacial and lake sediment in the northeast part of Yellowstone Nationa